
Many gemologists have difficulty mastering the direct-vision spectroscope. This article eases the pain.
Gem testing laboratories make use of a variety of instruments, both high-brow and low. Of primary importance are the microscope, refractometer, ultraviolet light, specific gravity equipment, and the spectroscope. Among these, the direct-vision spectroscope is generally the most difficult to initially master. This fear factor leads students into a self-fulfilling cul-de-sac where lack of skill leads to lack of success and the eventual conclusion that the spectroscope is of little use. Nothing could be further from the truth. The spectroscope is one of the most powerful instruments in a gemologist’s quiver. But, like any weapon, you hit little if you depend on luck alone. You gotta practice.
The tremendous value of the spectroscope as an analytical tool lies in its ability to save time in gem testing, by providing initial identification of many gems, with the microscope being the only other tool required.
For example, let’s say you are given a dark blue transparent stone set in a closed back mounting. The construction of the mounting does not permit the refractometer to be used. With the microscope and fiber-optic illumination you locate a small well-formed transparent crystal in the gem and using the fiber-optic light with the spectroscope you observe absorption lines in the blue region at 450, 460 and 470 nanometers (nm), a typical iron-caused visible light spectrum.
The conclusion is obvious: this gem is a natural sapphire, and the condition of the included crystal means the sapphire has not undergone high-temperature heat treatment. A complete identification was possible in this case with just two instruments. An added bonus in this instance was that no refractometer was needed, which saves the contact surface of the hemicylinder for when it is actually required.
Other examples of the spectroscope’s utility are in the determination of dyed green jadeite from natural Cr-colored jadeite, and in the detection of irradiated yellow diamonds, where the instrument is of crucial value. There is really no other way for a gemologist to get this important information except through spectroscopic examination.
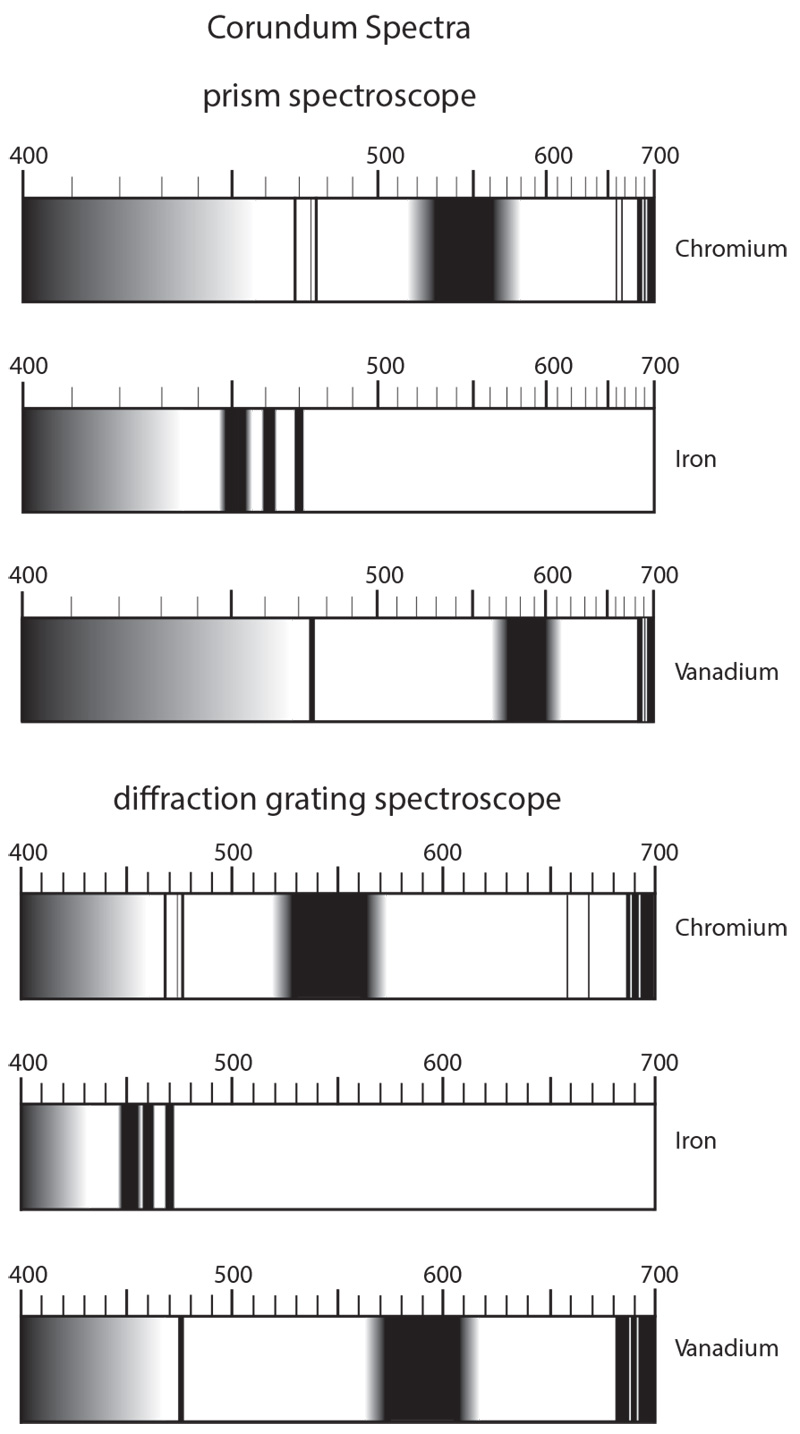 The three major types of visible spectra found in corundum, as viewed through a direct-vision prism vs. diffraction-grating spectroscope. Illustration from Ruby & Sapphire by Richard W. Hughes
Pattern Recognition
Whether you have a small pocket-sized diffraction-grating spectroscope without a built-in scale, or a table-top prism spectroscope with a built-in numerical scale, using a spectroscope is simply about pattern recognition. No matter which instrument you use, the positions of the absorption lines and bands will always be the same for any particular gem species that shows an absorption spectrum. As for example, iron lines will always be in the same areas of the blue region in an iron spectrum of a sapphire. The absorption pattern shown by a ruby will always be the same and in the same position in the visible light spectrum.
From almandine garnet to zircon, dozens of gems show diagnostic absorption patterns. The key to recognizing these patterns and associating them to a specific gem is practice. Whenever possible use your spectroscope. Put together an inexpensive set of spectral reference stones for practice and refer to articles and books that contain drawings of spectra such as Richard Liddicoat’s Handbook of Gem Identification, or Basil Anderson and Alan Jobbins’ Gem Testing. The way to spectroscope proficiency is practice. Learning the proper use of the spectroscope is easier than you think.
Successful Spectroscopy
Successful spectroscopy is largely a question of path length through the gem. Longer light paths allow more absorption, thus strengthening faint lines; shorter paths produce less absorption and so allow distinction of individual lines within areas of heavy absorption. Path length is determined by the following:
- Position of the gem: Stones must be carefully positioned so that only light passing through them reaches the spectroscope. Due to the arrangement of facets or inclusions, light may exit the stone in several different directions; the stone should be positioned so that the maximum amount of light passes out towards the spectroscope. Placing one’s hand around the stone in different positions allows one to determine exactly where the light is headed. Oval stones should be positioned so that the broad side faces the spectroscope. The stone’s position must also take into account color zoning. Absorption lines normally result from color, so the stone should be positioned so that light passes through deeply colored areas, to maximize absorption.
- Light source and its position: The light source itself is of tremendous importance. It must be intense, and focusable to a narrow spot. Fiber-optic illuminators of 150 watts or more work well for spectroscopy. A small angled light guide can then be held against the stone. The light may be positioned to allow transmission directly through the stone from below or reflected from above. In most cases, the reflection method is superior, for it allows a longer path through the stone and, thus, more absorption. If too much absorption is seen, the path should be shortened by moving the light and/or stone to lessen the absorption. For example, shortening the path in Fe-rich Thai/Cambodian rubies may allow one to pick out the iron lines at 451.5, 460, and 470 nm, in addition to the Cr spectrum. Lengthening the path intensifies faint lines, which allows one to see the 451.5 nm complex in heat-treated Sri Lankan sapphires, where it is normally weak.
Once one understands the implications of path length, it is simply a question of positioning the instrument in the proper spot to catch the light. Always make sure the spectroscope is firmly anchored, either with the supplied holder on table models, or with modeling clay or plasticine.
Tips
Despite the lovely colors one sees with the spectroscope (and the occasional bright emission line due to fluorescence), what we are really looking for are achromatic gray-to-black areas of absorption.
The human eye contains two different components: cones and rods. The cones are concentrated in the center of the eye and are responsible for detecting color. Rods have a greater density on the side of the eye and are responsible for detecting differences in tone (black, white and gray). With the direct-vision spectroscope, we are mainly concerned with tone. As a result, you will be better able to detect faint absorption lines if you look at them from the side of your eye (using your peripheral vision where there are more rods) rather than looking straight at them.
Spectroscope Types
For many years, the king of gemological spectroscopes was the Beck prism model, a five-prism jewel that has assumed almost legendary status amongst the gemological cognoscenti. Sadly, it has not been manufactured for over since the 1980s and units today are coveted.
But there is an alternative. The mid-1980s saw the rise of inexpensive fixed slit diffraction-grating models from OPL, bringing top-quality spectroscopy within the reach of the commoner.
We use the large OPL "teaching" spectroscopes with the stand. They are affordable enough that every gemologist can have one, and when coupled with the same fiber-optic light source used for the microscope, gives gemologists a powerful tool.
Diffraction grating units have several advantages. First, the fixed slit means one less adjustment to fret about. Even more important, diffraction-grating spectra do not suffer the bend-me-crush-me extremism common to prism models, which simultaneously pull the violet and push the red. The result is a balanced display of colors. Not only does this make faint lines in the blue and violet easier to resolve, but tightly packed absorption striae at the red end spread out for greater visibility. We can almost picture Buddha nodding in agreement. Balance, the middle road. Oh, yeah!
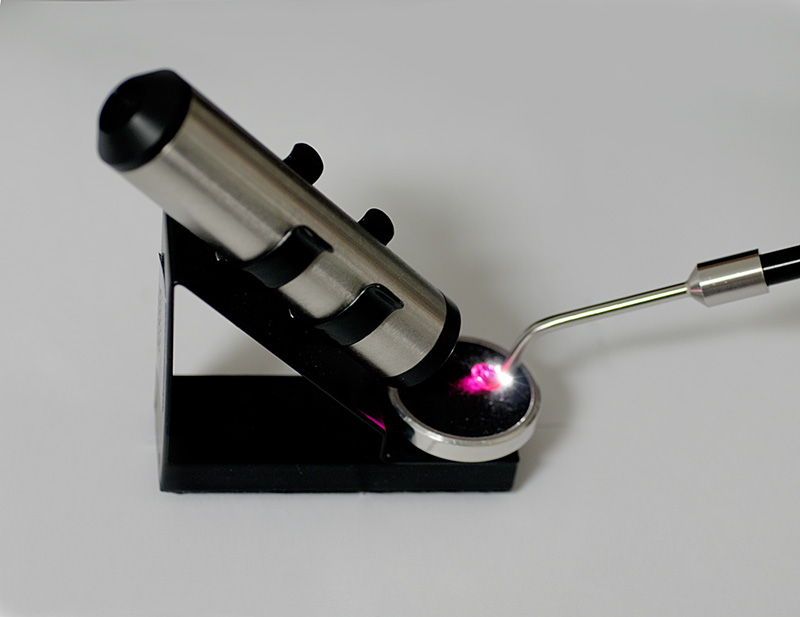 The desk model OPL spectroscope on an angled stand. When combined with a fiber-optic light source, this instrument is both inexpensive and powerful. Photo: R.W. Hughes
| Variety | Spectra description (from 400 to 700 nm)a |
|---|---|
| Ruby (including pink) |
|
| Blue sapphire |
|
| Violet/purple sapphire |
|
| Yellow sapphire |
|
| Orange sapphire |
|
| Green sapphire |
|
| Colorless sapphire |
|
| Color-change sapphire |
Vanadium spectrum (common in synthetic; rare in natural corundum)
Cr/Fe spectrum (common in natural and Verneuil synthetic corundum)
|
| a All wavelengths are approximate only. b Pleochroism can slightly affect the absorption spectrum. By rotating a polaroid plate over the spectroscope eyepiece, the spectra of both the ordinary and extraordinary rays can be viewed independently. |
|
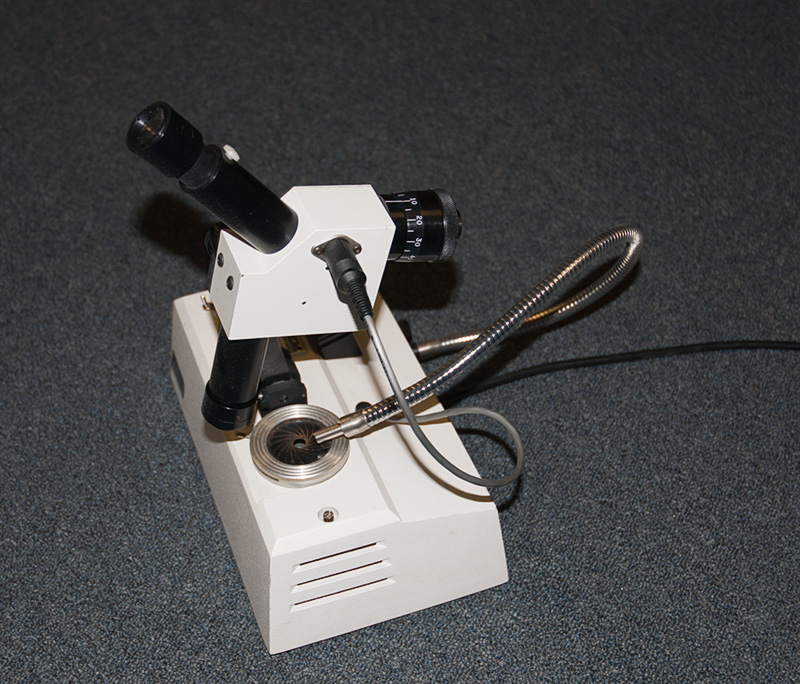 A scanning spectroscope once produced by Gem Instruments. Rotating the calibrated drum on the right of the instrument while viewing the spectrum through the eyepiece rolls the spectrum past a crosshair. When the absorption line is lined up with the crosshair, the exact wavelength can be read off of a digital LED display on the top of the instrument. The instrument is excellent for measuring the exact wavelengths of fine absorption and emission lines. Photo: R.W. Hughes
Summing Up
Cos Altobelli, the award-winning AGS gemologist, appraiser and jeweler, summed up the importance of the spectroscope this way: “For most gemologists and jewelers, the spectroscope is like a tuxedo. While you don’t need it often, when you do, there is no substitute.”
So dust off the tuxes and ball gowns. And, while you’re at it, make sure your spectroscope is working, too, because you never know when it will be needed.
![]()
Postscript
Outdoors and In
For those who are completely new to spectroscopy, there are a couple of fun things you can do to acquaint yourself with the instrument. The first is to walk outside in the sunlight and point your spectroscope at the sky. What you will see is the classic "solar spectrum" of colors from violet to red. But if you look carefully, you'll also see a series of thin absorption lines. These are known as Fraunhofer lines, so named after the man who discovered them. They are caused by absorption from elements in the gases surrounding the sun and earth.
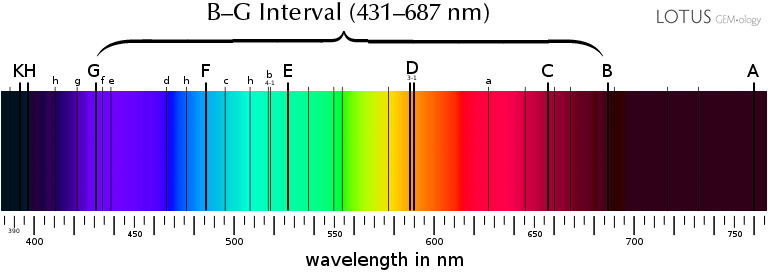 Fraunhofer lines in the solar spectrum. These are used as reference points. All refractive indices (n) are calibrated for light of 589 nm, matching the Fraunhofer D line (nD). Dispersion in gemology is measured as the difference in RI between the Fraunhofer B and G lines.
Now that you know what an absorption spectrum looks like, move back indoors and point your spectroscope at a fluorescent indoor light. Here you will see the violet to red spectrum, but in certain places, a series of bright "emission" lines. Fluorescent light bulbs are made by coating the inside of the glass with phosphors that will "fluoresce" when exposed to shortwave ultraviolet light. By carefully selecting the phosphors, they can provide illumination across the visible spectrum, giving the illusion of white light. The process is extremely energy efficient, which is why they have largely replaced "incandescent" lights, which require much more energy to produce usable visible light.
Because sunlight and fluorescent lights (and LED's) have their own absorption/emission spectra, they should never be used as light sources for the spectroscope. For spectroscopy, incandescent "continuous spectrum" light sources are required.
Beyond the Direct-Vision Spectroscope
While the direct-vision spectroscope is a wonderful tool that almost anyone can afford, it does have significant limitations. The human eye has a difficult time recognizing broad areas of absorption and also at quantifying absorption, and it is limited to the 400–700 nm visible range. This is where an Ultraviolet-Visible-Near-Infrared (UV-Vis-NIR) spectrophotometer shines. Such instruments measure the absorption and emission of light across a broad range, anywhere from 200–1000 nm, and display the results in graph form.
A. 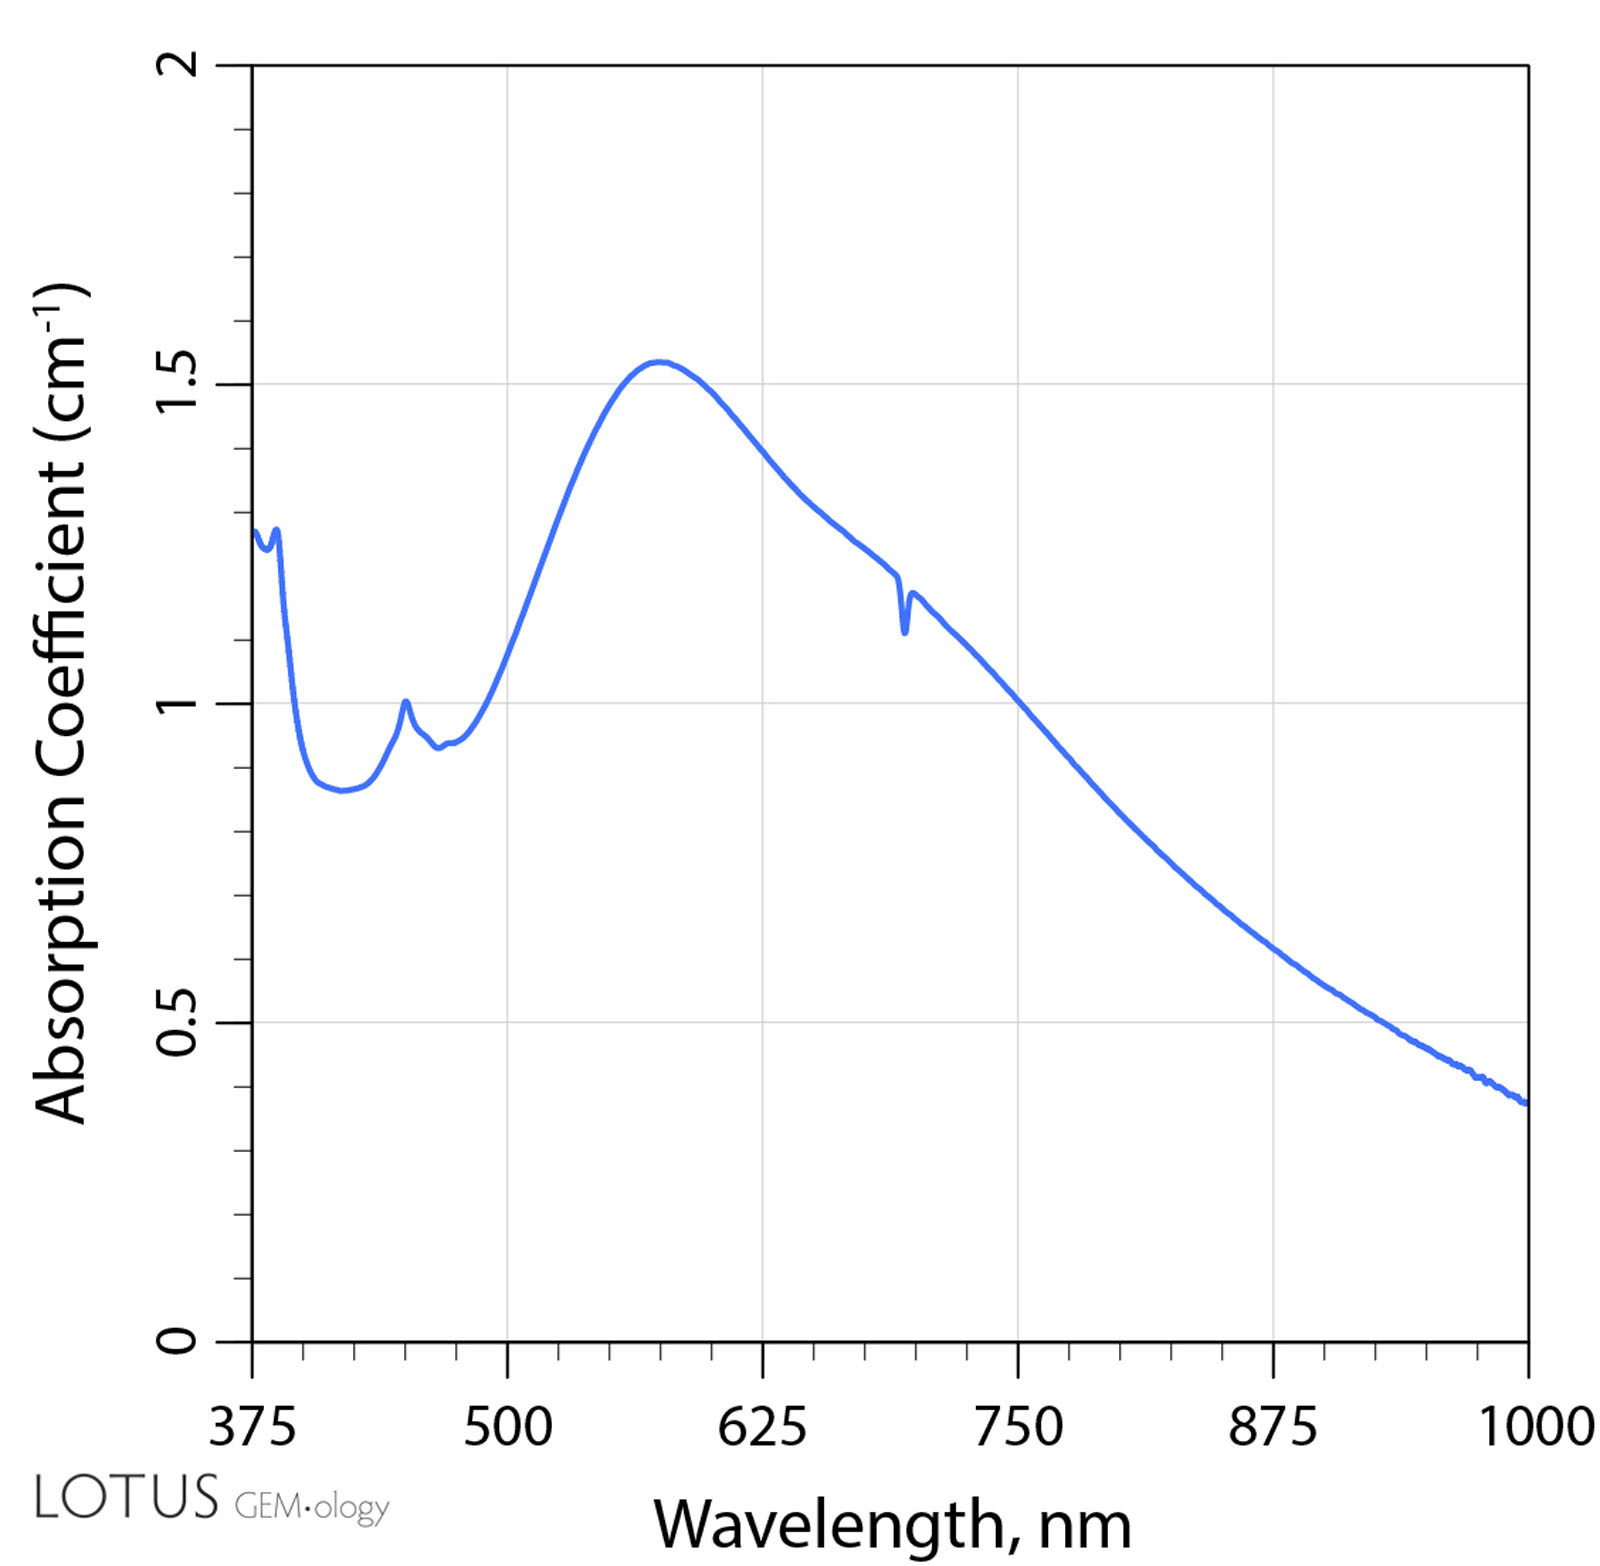 |
B. 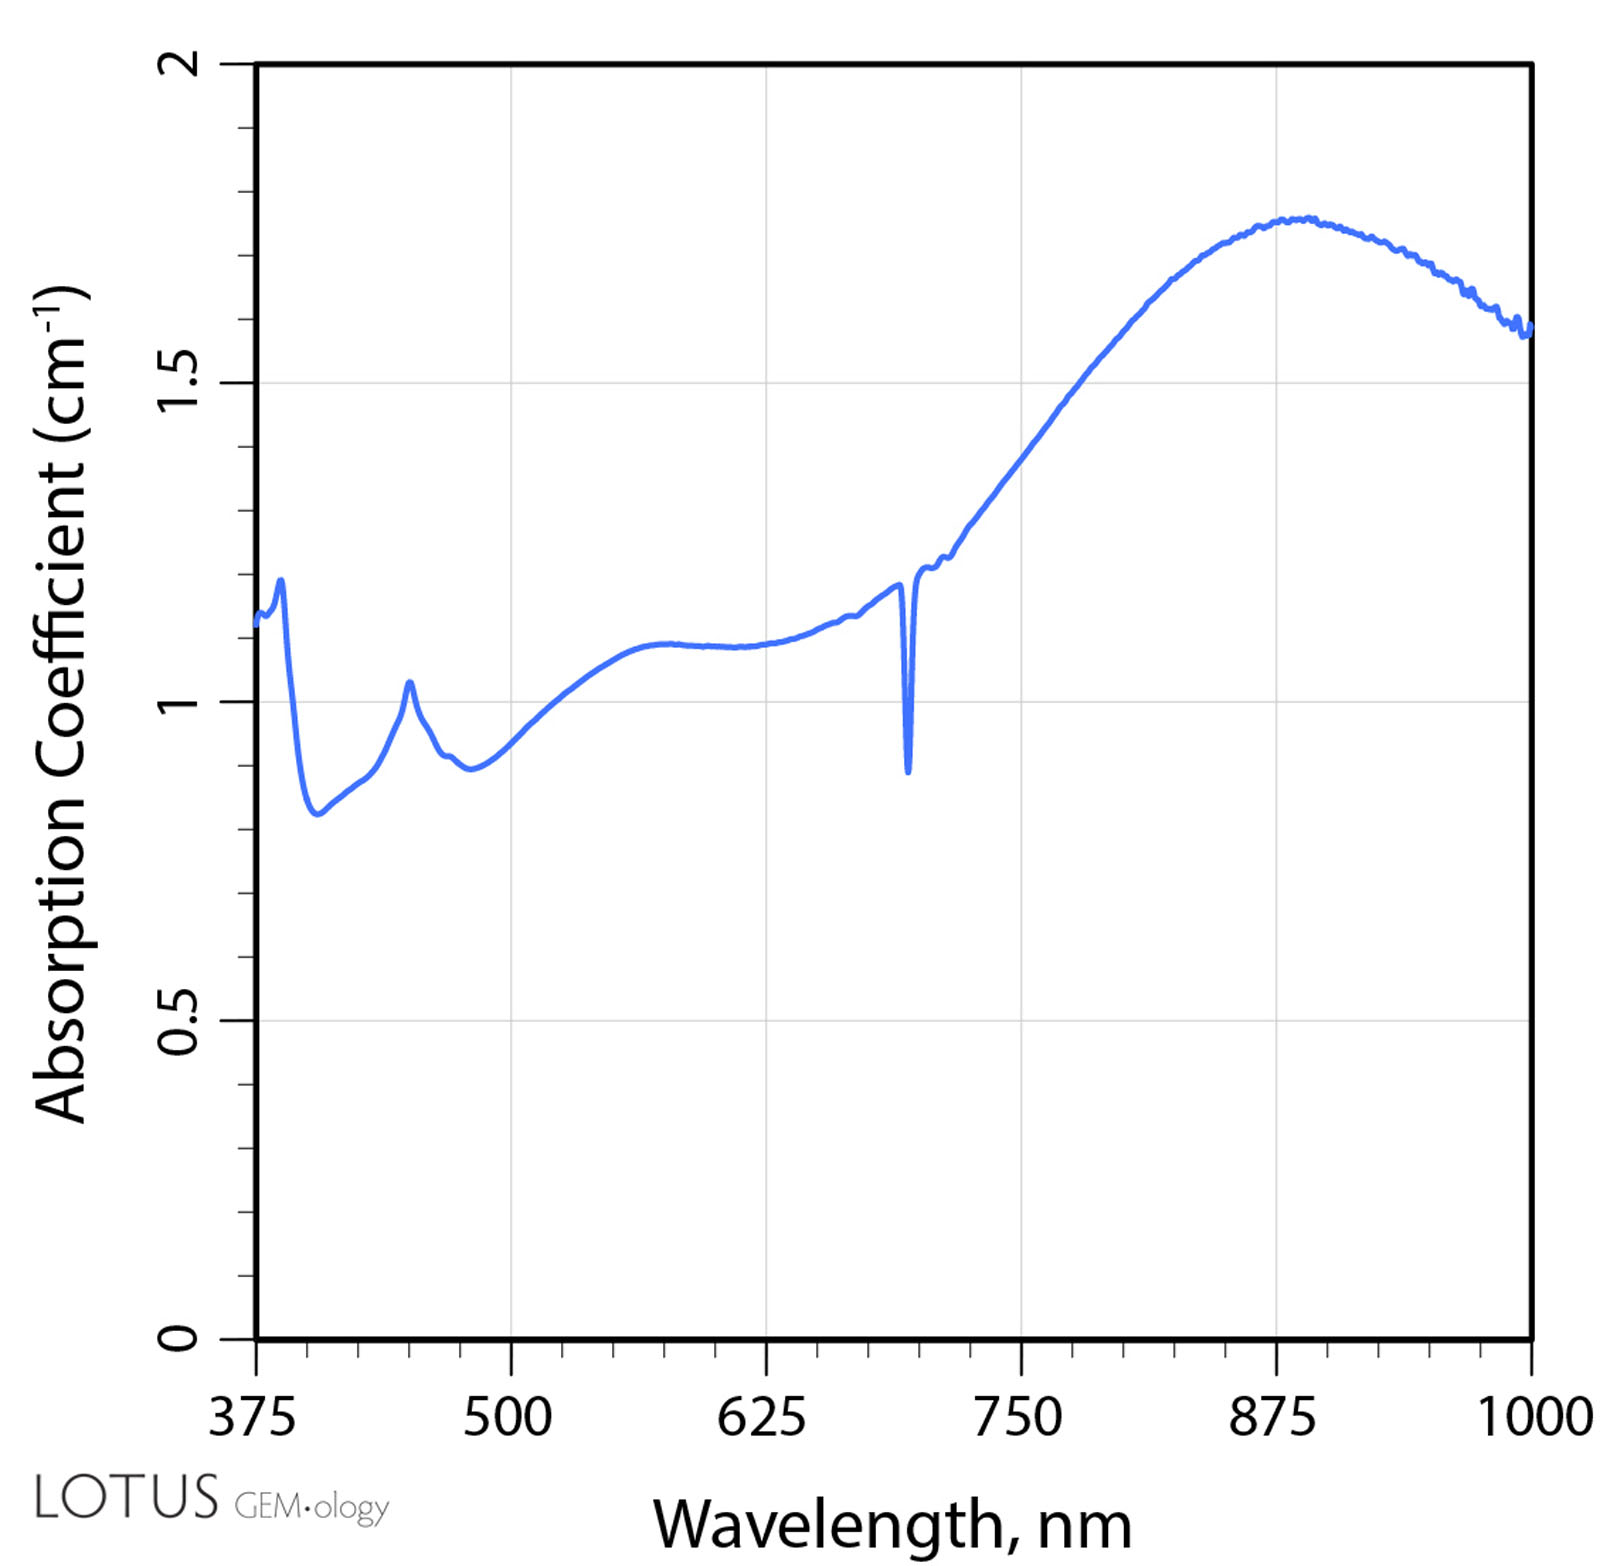 |
|
UV-Vis-NIR spectrum of a Madagascar sapphire before and after heating |
|
The expanded range, ability to quantify absorption/emission and detect broad areas of absorption/emission provide far more useful information than that gleaned by a direct-vision spectroscope. And there is little learning curve involved in using and interpreting the data. While we still use the hand spectroscope, where possible, every gem tested at Lotus Gemology has its spectrum measured by a UV-Vis-NIR spectrophotometer. Once you learn to recognize the patterns, you can quickly identify many gems, and certain spectral features can be incredibly useful in identifying not just gem varieties, but also treatments and synthetics. The instrument we use is the Magilabs Gemmosphere.
For those who wish to delve deeper into gemological spectroscopy, Chapter 4 of our Ruby & Sapphire: A Gemologist's Guide has an extensive discussion of the UV-Vis-NIR, fluorescence and infrared spectra of corundums.
![]()
About the authors
John I. Koivula, B.A., B.Sc., G.G., F.G.A., Fellow Royal Microscopical Society is the co-author of the magnificent Photoatlas of Inclusions in Gemstones, Vols. 1–3 and the author of the MicroWorld of Diamonds, along with several other books and numerous articles. He is currently Analytical Microscopist at the Gemological Institute of America and is the world's foremost gem photomicrographer and inclusionist. John’s images have graced the covers and contents of numerous books and journals. In addition, he won 1st Place and others in Nikon’s Small World photomicrographic competitions. Koivula is an honorary life member of both the Finnish Gemmological Society and the Gemmological Association of Great Britain, and was named as one of the 64 most influential people of the 20th century in the jewelry industry by Jewelers' Circular Keystone magazine and one of the 50 most important figures that have shaped the history of gems since antiquity by the Association Française de Gemmologie (AFG). John was bestowed The Richard T. Liddicoat Award from GIA in 2009. He also has been awarded the Robert M. Shipley Award by the American Gem Society, the Scholarship Foundation Award by the American Federation and California Federation of Mineralogical Societies, the Antonio C. Bonanno Award for excellence in gemology by the Accredited Gemologists Association, and Koivula was the first recipient of the Richard T. Liddicoat Journalism Award from the American Gem Society. John was also the technical and scientific advisor to the famous MacGyver television series from 1986–1993. Many of his books can be seen at www.microworldofgems.com, and are available from the GIA and Gem-A bookstores.
Richard W. Hughes is one of the world’s foremost experts on ruby and sapphire. The author of many books and over 170 articles, his writings and photographs have appeared in a diverse range of publications, and he has received numerous industry awards. Co-winner of the 2004 Edward J. Gübelin Most Valuable Article Award from Gems & Gemology magazine, the following year he was awarded a Richard T. Liddicoat Journalism Award from the American Gem Society. In 2010, he received the Antonio C. Bonanno Award for Excellence in Gemology from the Accredited Gemologists Association. The Association Française de Gemmologie (AFG) in 2013 named Richard as one of the Fifty most important figures that have shaped the history of gems since antiquity. In 2016, Richard was awarded a visiting professorship at Shanghai's Tongji University. 2017 saw the publication of Richard and his wife and daughter's Ruby & Sapphire • A Gemologist's Guide, arguably the most complete book ever published on a single gem species and the culmination of four decades of work in gemology. In 2018, Richard was named Photographer of the Year by the Gem-A, recognizing his photo of a jade-trading market in China, while in 2020, he was elected to the board of directors of the Accredited Gemologists Association and was appointed to the editorial review board of Gems & Gemology and The Australian Gemmologist magazine. In 2022, Richard published Jade • A Gemologist's Guide, while 2024 brought Broken Bangle • The Blunder-Besmirched History of Jade Nomenclature. His jade trilogy was completed in 2025 with his translation of Heinrich Fischer's Nephrite and Jadeite.
Notes
This article was originally penned as one of our regular Elemental columns for the American Gem Society's Spectra magazine in 2005–2006. It has been updated with references and additional information.
References & further reading
- Anderson, B.W. and Jobbins, E.A. (1990) Gem Testing. London, Butterworths, 10th edition, 390 pp.; RWHL*.
- Anderson, B.W. and Payne, C.J. (1953–1957) The spectroscope and its applications to gemmology. The Gemmologist, Sept. 1953–Jan. 1957, No. 276, pp. 119–123 (Part 11: Absorption and fluorescence spectrum of ruby); No. 291, pp. 195–197 (Part 26: Absorption spectra of sapphire and chrysoberyl); No. 302, pp. 158–161 (Part 37: Synthetic gemstones); RWHL*.
- Anderson, B.W., Payne, J. and Mitchell, R.K., (ed.) (1998) The Spectroscope and Gemmology. Woodstock, VT, GemStone Press, 288 pp.; RWHL*.
- Hughes, R.W. (1997) Ruby & Sapphire. Boulder, CO, RWH Publishing, 512 pp.; RWHL*.
- Hughes, R.W., Manorotkul, W. and Hughes, E.B. (2017) Ruby & Sapphire: A Gemologist's Guide. Bangkok, Lotus Publishing, 816 pp.; RWHL*.
- Liddicoat, R.T. (1989) Handbook of Gem Identification. Santa Monica, CA, Gemological Institute of America, 12th edition, 450 pp.; RWHL*.
- Winter, C.H. (2003) OPL: A Students' Guide to Spectroscopy. Leatherhead, Surrey, UK, OPL Press, 2nd ed., 2014, 85 pp.; RWHL*.
![]()