Madagascar has become one of the world’s top sources of fine blue sapphire in recent times. In addition to beautiful untreated material, increasing numbers of treated stones have appeared in the market. Some have been heated to relatively low temperatures, below 1350°C, to lighten their color. To help separate unheated and heated Madagascar sapphire, the authors performed experiments to document the changes they undergo with low-temperature heat treatment in air, which is an oxidizing atmosphere.
Introduction to this Madagascar Sapphire Study
This study was sparked by a 2017 comment from noted Australian gemologist Terry Coldham. In Bangkok he ran into a friend with a parcel of Madagascar sapphire. Mr. Coldham’s friend said he was going “to the burner,” hoping to “sweeten” the color with a low-temperature treatment that would lighten the hue. He indicated that the temperatures they were using were likely below 1000°C. This coincided with the sapphire rush at Bemainty (Perkins & Pardieu, 2016) that produced high-quality blue sapphires (figure 1), ranging from lighter colors with a lower iron content to much deeper blues with a higher iron content (Pardieu et al., 2017).
The abundance of blue sapphires from Madagascar being tested at Lotus Gemology in Bangkok, along with rumors of lower-temperature heat treatment (see “Defining ‘Low’ Temperature” below), suggested the need for further study and heat treatment experiments on this material. Our aim was to record the characteristics of Madagascar sapphires and to detect this type of heat treatment.
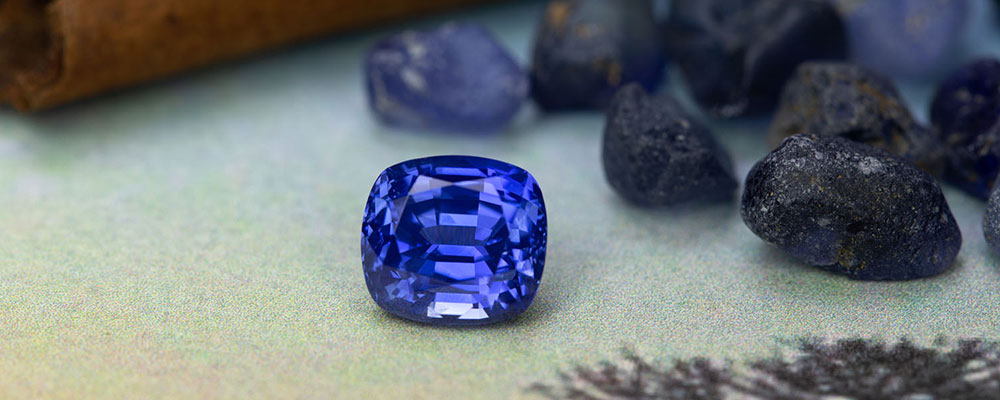
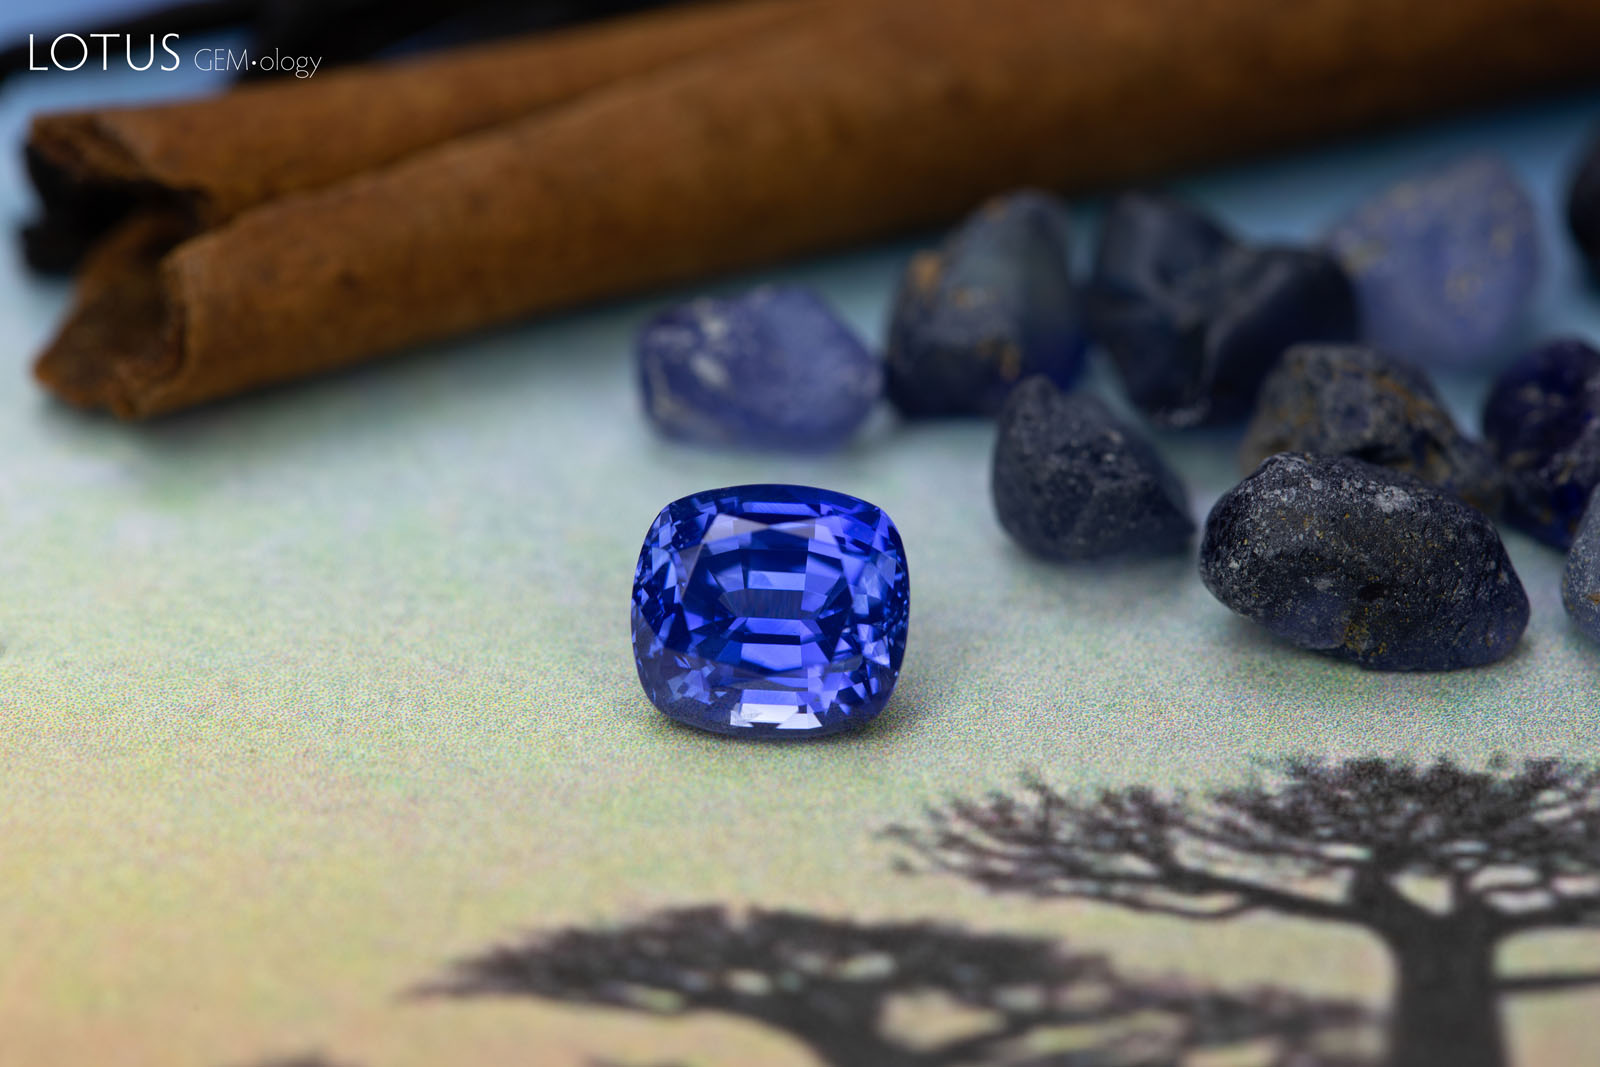 Figure 1. Sapphires from Madagascar: A beautiful 3.29 ct untreated faceted stone and an assortment of rough in the background. Madagascar has produced many high-quality stones in the last few years and is quickly gaining a reputation for fine sapphires equal to any on the planet. Photo by Wimon Manototkul, sapphire courtesy of Neil Doohan.
Geology
Approximately 750–500 million years ago, Madagascar was a part of the Gondwana supercontinent, sandwiched between what are now East Africa, southern India, and Sri Lanka. Today this region, known as the Mozambique (Pan-African) Orogenic Belt, is home to some of the world’s richest corundum deposits (Hughes et al., 2017). Many regions that were a part of this belt are now the world’s top producers of ruby and sapphire (see figure 2, top).
The majority of sapphire in Madagascar is metamorphic (though basalt-related sapphire is found in the far north) and recovered from secondary deposits (figure 2, bottom). It is not certain when these sapphires would have formed, but the literature suggests that they are likely 650–560 million years old (Kröner et al., 1999; Link, 2015).
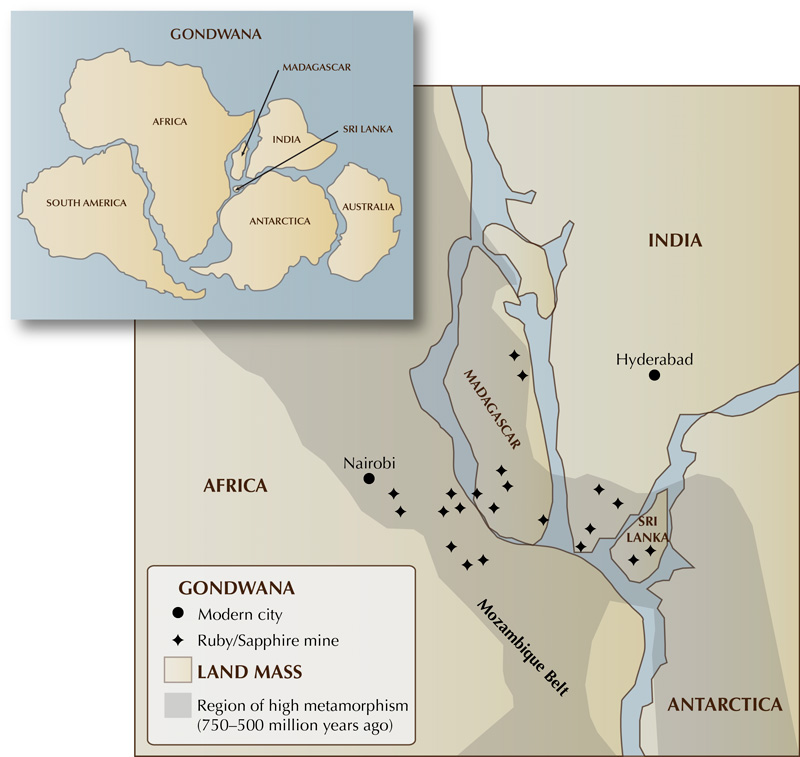 Figure 2A: This map of Gondwanaland illustrates how close Sri Lanka and Madagascar were to each other when their sapphire deposits were forming. This proximity may account for the similarities between much of the blue sapphire from the two origins.
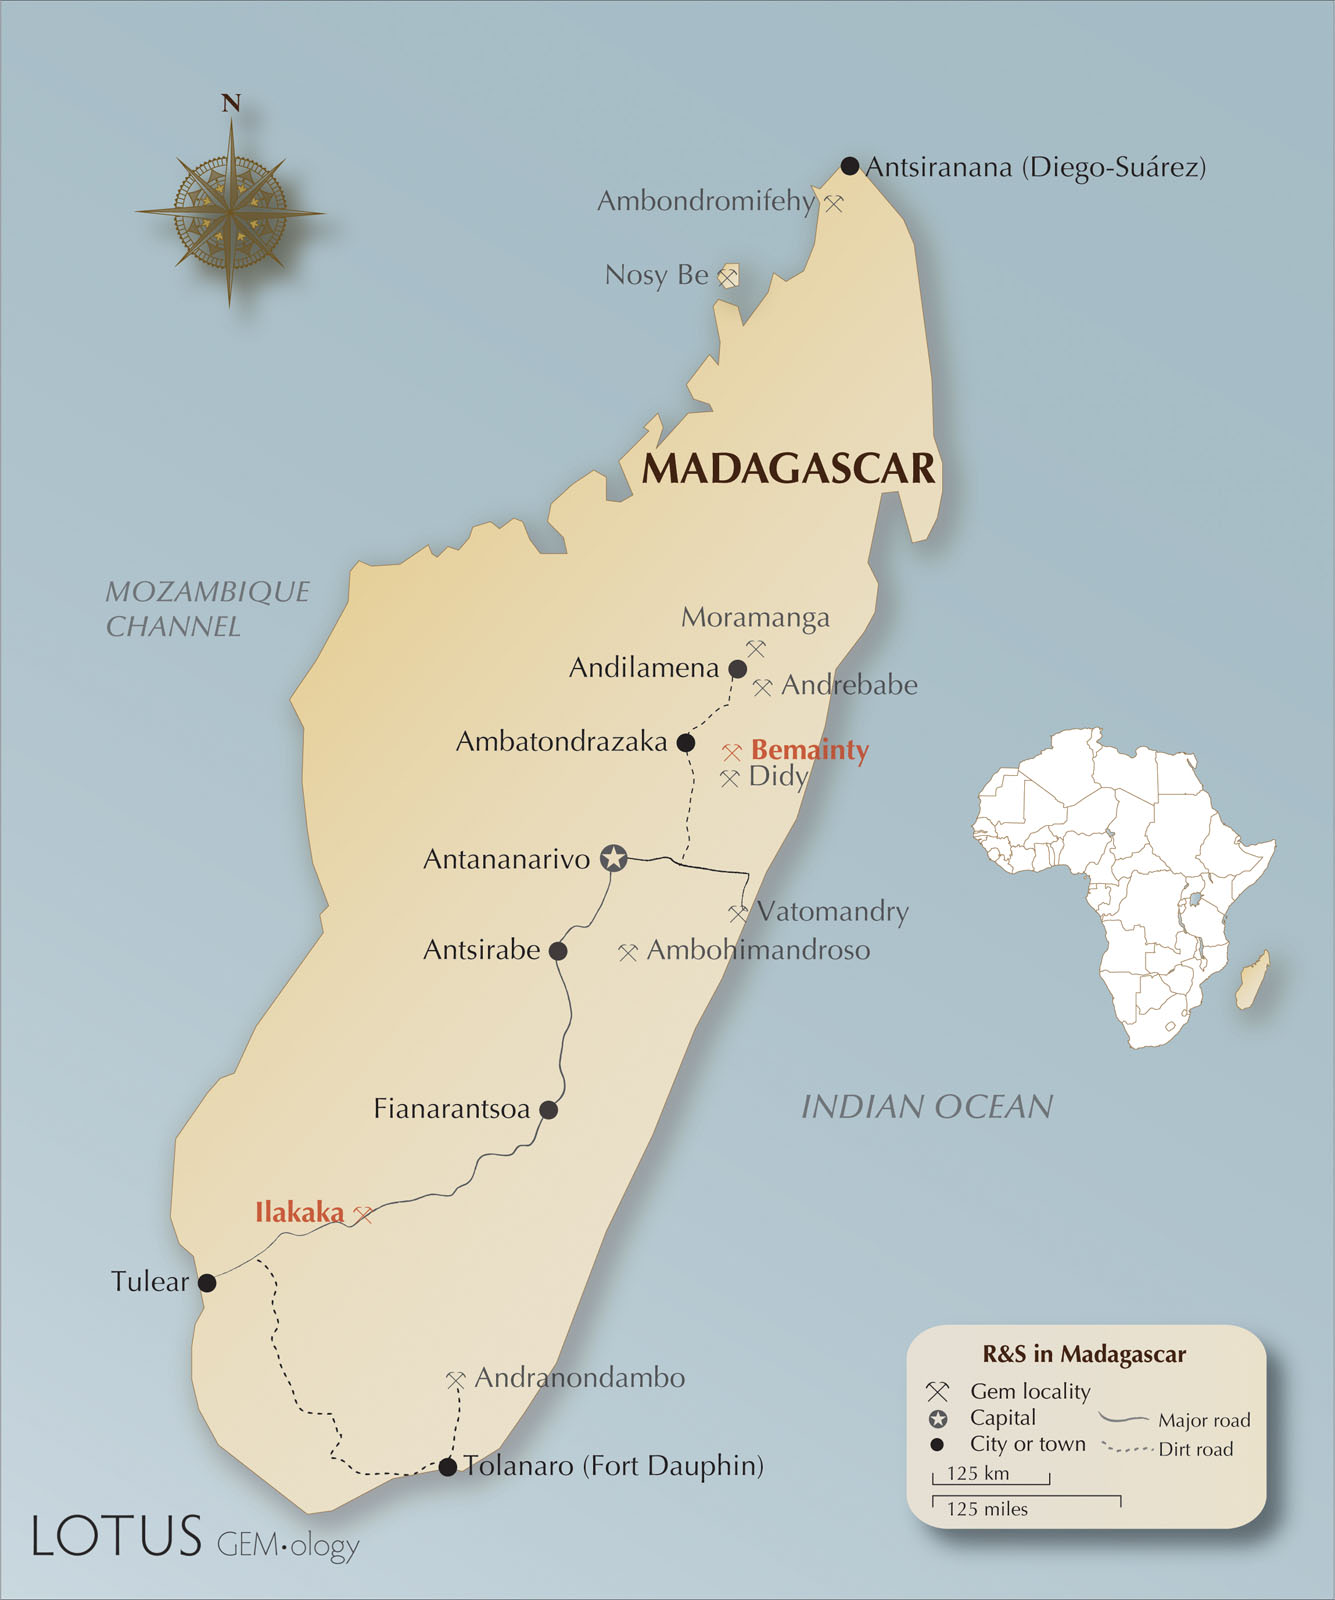 Figure 2B: Map of Madagascar, including the most notable corundum localities. Ilakaka, Bemainty, and Andranondambo, the sources of samples used in this experiment, are highlighted in red. Maps by Richard Hughes.
Because of Madagascar’s proximity to modern-day Sri Lanka at the time when sapphires were forming within the earth, it is understandable that there would be an overlap between sapphires from these two origins in terms of colors and internal features, sometimes making them difficult to separate.
The island of Madagascar, one of the most biodiverse in the world, offers an incredible wealth of gems. Some estimate that potentially 90% of the land is gem-bearing (Hughes, 2006). Most of the important ruby and sapphire finds are concentrated toward the eastern part of the island. Significant gem rushes at primary-type deposits near Andrebabe, Andilamena, and Didy lie on the boundary between the Antananarivo and Tsaratanana units (Rakotondrazafy et al., 2008; Pardieu et al., 2017). In the south there has been notable production of both blue and fancy-color sapphire, with mining and trading concentrated around the town of Ilakaka (figure 3).
 Figure 3. Sapphire Miners Near Ilakaka, Madagascar
Miners move gem-bearing gravel near Ilakaka. Most of the sapphire production in Madagascar is by small-scale miners working with artisanal tools. Photo by E. Billie Hughes.
Experiments and Results
Samples
Twelve untreated Madagascar blue sapphire samples selected from parcels from three locations were prepared for the heating experiments. Samples 1–4 were collected by Rosey Perkins in 2017 in Bemainty, Madagascar. Samples 5–8 were purchased by a team from Lotus Gemology on a 2016 trip to Ilakaka, Madagascar. Samples 9–12 were obtained in Bangkok from a lot of rough Andranondambo sapphire from Simon Dussart of Asia Lounges and Isaac Stern. All stones were examined before heating and showed characteristics consistent with untreated Madagascar sapphire (Peretti and Peretti, 2017; Krzemnicki et al., 2017).
Sample Preparation
Four samples were selected from each of the three parcels from Bemainty, Ilakaka, and Andranondambo, according to their color and inclusions. Preference was given to those of darker color with characteristic inclusions, and several showed color zoning. Darker samples were chosen because we were particularly interested in seeing what temperatures would lighten overly dark material. Then all 12 samples were polished into wafers measuring approximately 2–5 mm in thickness. The stones were acid cleaned in a mixture of 50% hydrochloric and 50% hydrofluoric acid for approximately 48 hours before being heated. After the final round of heating, the samples were repolished slightly to eliminate surface damage that occurred as a result of heat treatment.
Heating
After acid cleaning, we examined and recorded data on the 12 stones. Then we heated them in air, which is an oxidizing atmosphere, to 800°C, 900°C, 1000°C, and 1100°C for eight hours at each temperature with a Vulcan 3-550 oven (figure 4). They were further heated in air to 1300°C and 1500°C by John L. Emmett with a Lindberg 51333 oven. The stones were placed on corundum felt while being heated.
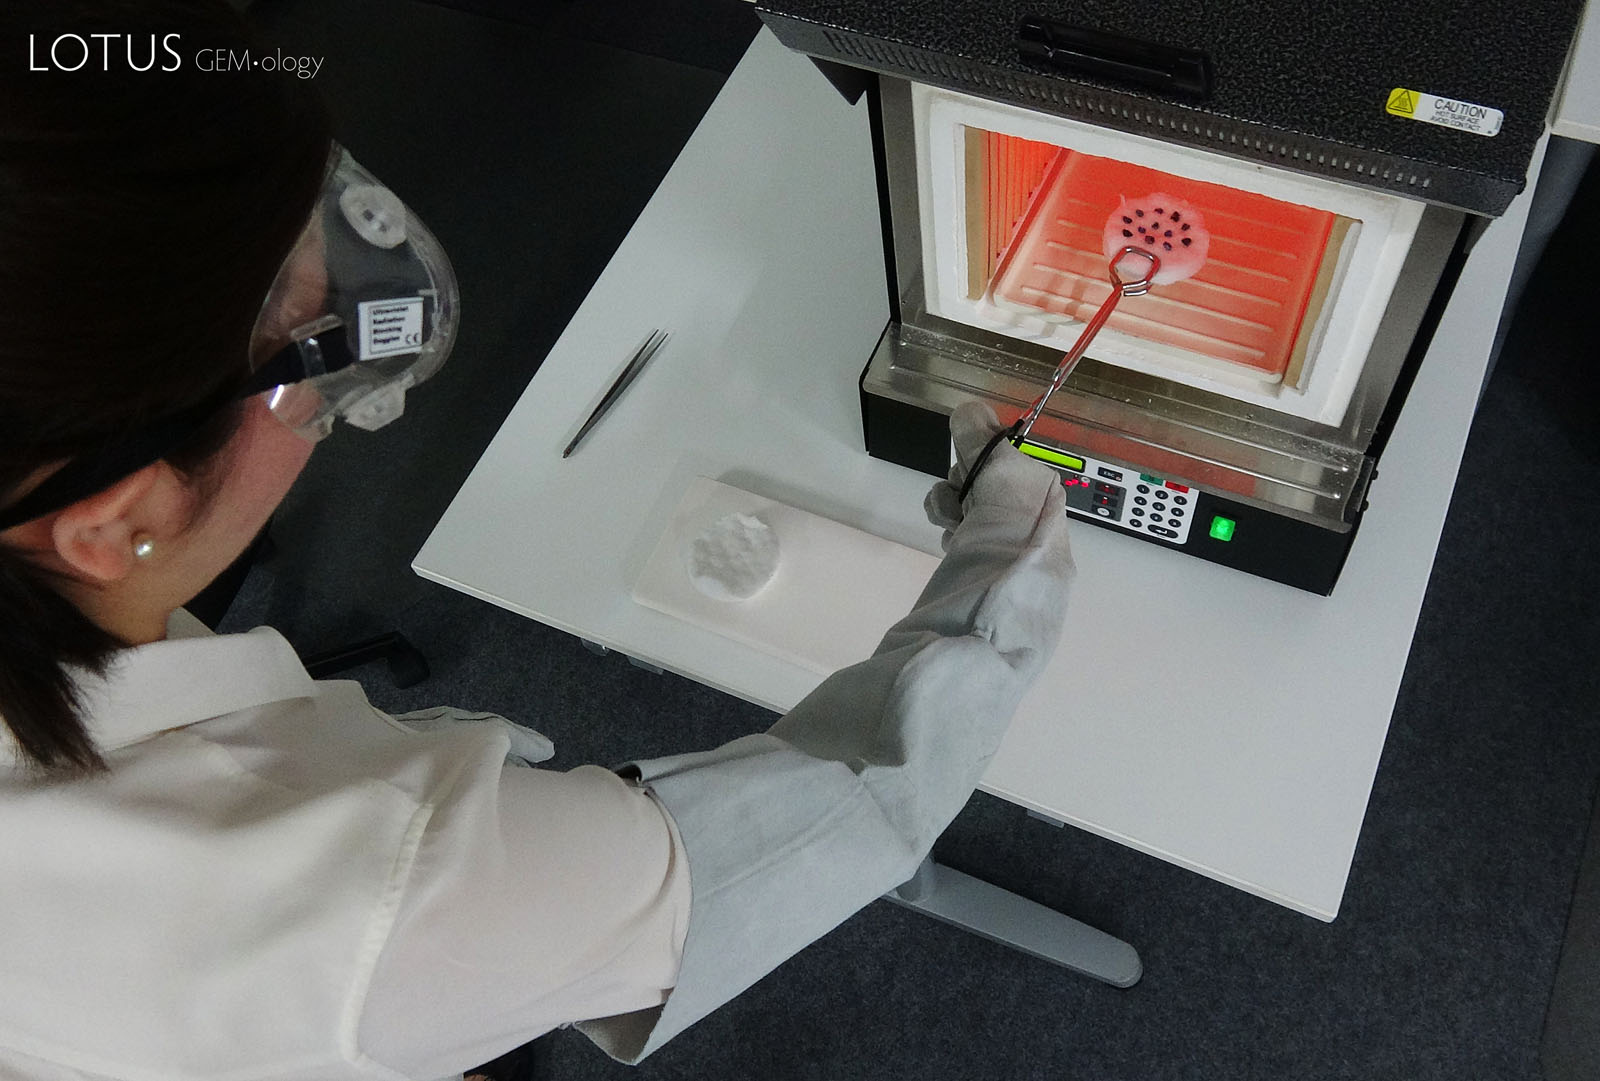 Figure 4. Removing Sapphires from the Oven After Heating
E. Billie Hughes removes the samples from the Vulcan 3-550 oven after a heating session. Photo by Rosey Perkins.
Defining “Low” Temperature
While some dealers that we spoke to defined low-temperature treatment as below 1000°C, for research purposes we define it slightly differently. High-temperature treatment involves the dissolution of secondary-phase microcrystals, while low-temperature treatment does not. The most common of these microcrystals in corundum is rutile silk. Rutile dissolution can occur around 1200–1350°C, which we use to define the approximate boundary between low- and high-temperature treatments (Hughes et al., 2017). Because of this, we focused our experiments on four “lower”-temperature rounds of heat ranging from 800 to 1100°C, one “intermediate” round at 1300°C, which we can consider a borderline area, and one “high” round at 1500°C for contrast.
EDXRF
Energy-dispersive X-ray fluorescence (EDXRF) bulk analysis was performed using a Skyray EDX 6000B. We obtained chemical composition on all samples before heating (table 1). The detection limits were 1–3 ppmw (0.5–1 ppma) for Ti, 3–7 ppmw (1–3 ppma) for V, 3–7 ppmw (1–3 ppma) for Cr, 14 ppmw (5 ppma) for Fe, and 1–4 ppmw (1 ppma) for Ga. Dr. Andreas Burkhardt calibrated the corundum procedure with natural and synthetic corundum standards analyzed with laser ablation–inductively coupled plasma–mass spectrometry (LA-ICP-MS) and electron microprobe (EMPA) at the University of Bern and the University of Basel, Switzerland. The most interesting feature was the wide range of iron (Fe) levels, ranging from sample 10 at 243 ppma to sample 2 at 2465 ppma.
Macro Photography
Photos were taken with a Canon EOS 6D camera with a 65 mm lens clamped to a copy stand. Samples were placed on a light box powered by an XD-300 (xenon) light source. Photos were recorded before any heating and after each eight-hour round of heating at each temperature (figure 5).
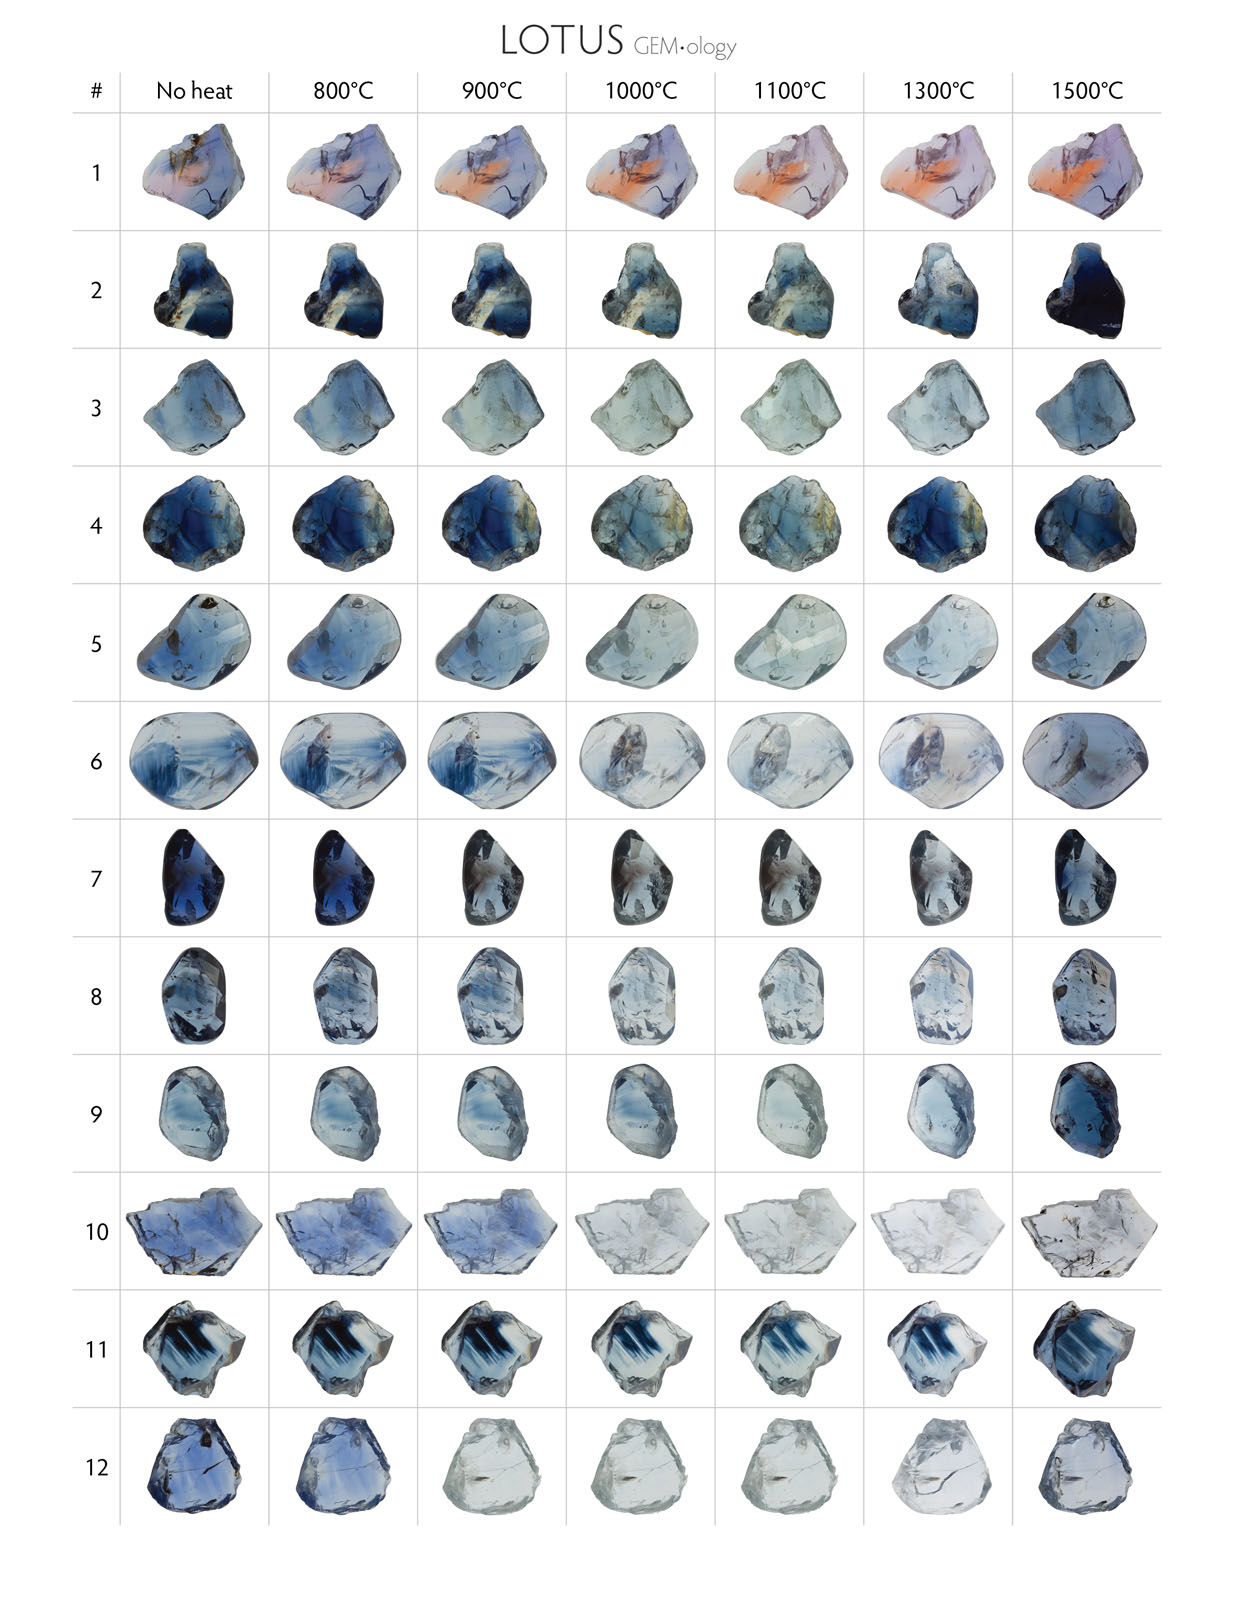 Figure 5. Madagascar sapphire before and after heating The 12 samples, shown before and after heating to each temperature. Most of the samples began to lighten significantly after heating to about 900–1000°C and started to deepen in color again around 1300°C. After heating to 1500°C, many pieces became significantly deeper in color. Photos not to scale. Photos by Rosey Perkins and Sora-at Manorotkul.
Sample 1, unlike the others tested, had a strong pink zone in addition to blue color zoning. This pink zone became a stronger orange with each round of heating (this has long been rumored to take place in Sri Lanka). The blue zoning in the piece started to lighten and turn a purplish color, particularly after heating to 1100–1300°C, and started to become more strongly blue again after heating to 1500°C.
Inclusions
Inclusion photomicrographs were taken with a Canon EOS 6D camera connected to an Olympus SZX16 microscope using an SDF PLAPO 0.8x lens. A variety of inclusions showed signs of alteration once the stones were heated. Some of the changes started to become evident after the first round of heating at 800°C, while others developed at higher temperatures. Many of the changes that began at lower temperatures became increasingly dramatic as temperatures rose.
One of the first changes we began to notice was the development of fissures. Even after the first rounds of heating at 800°C and 900°C, shiny fissures appeared around many of the included crystals. As the stones were heated to higher temperatures, such fissures tended to grow larger, with glassy areas, evident in figures 7, 8, 9, and 11. Around 1300°C, some of these glassy areas started to “neck down” and form small bubbly channels that looked like “fingerprints” (Hughes and Emmett, 2004). In sample 3, which had a large partially healed fissure even before heat treatment, some of the tube-like channels in the fissure displayed clear signs of alteration after heat to 1500°C and developed rounded shapes (figure 6).
A. 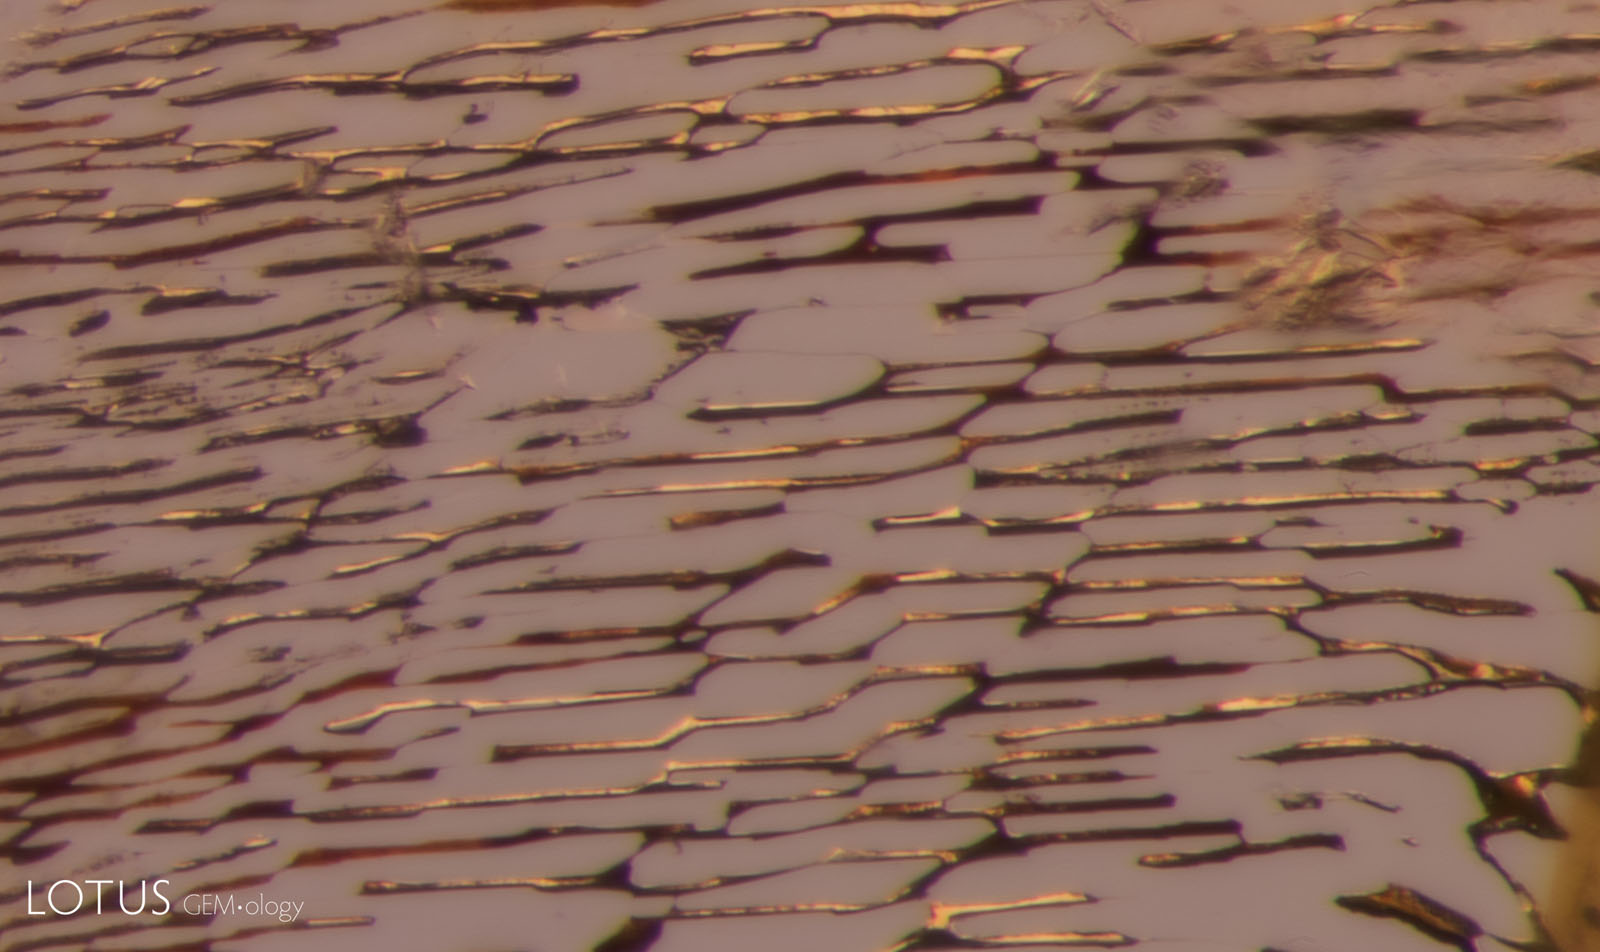 |
B. 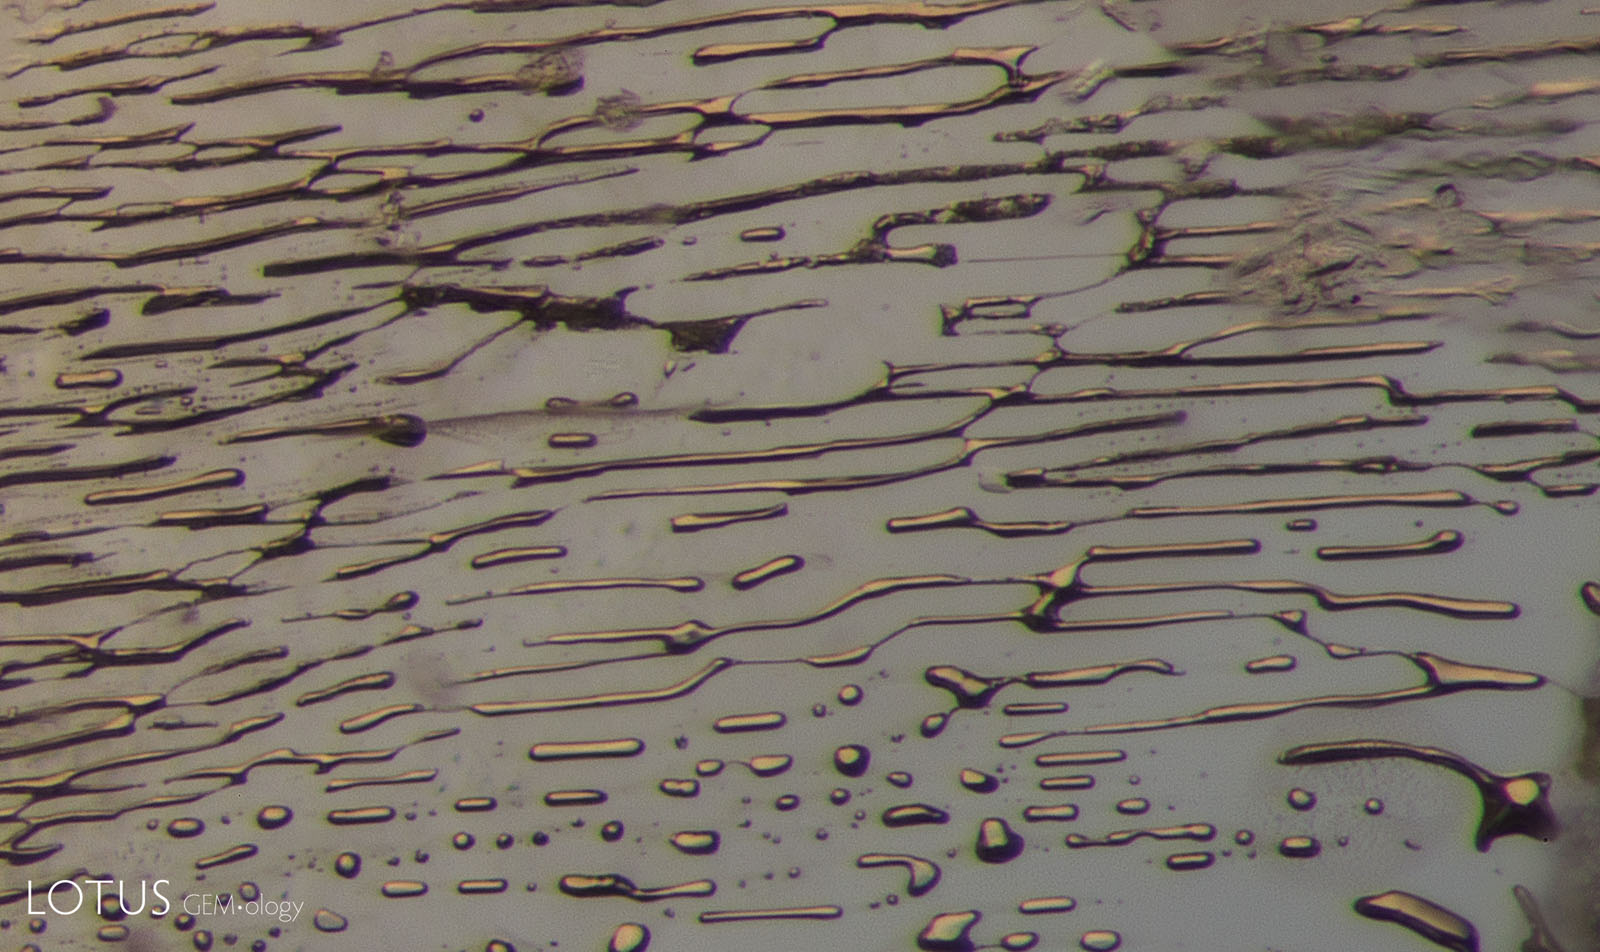 |
|
Figure 6. Secondary tube channels in Madagascar sapphires before and after heating |
|
A. 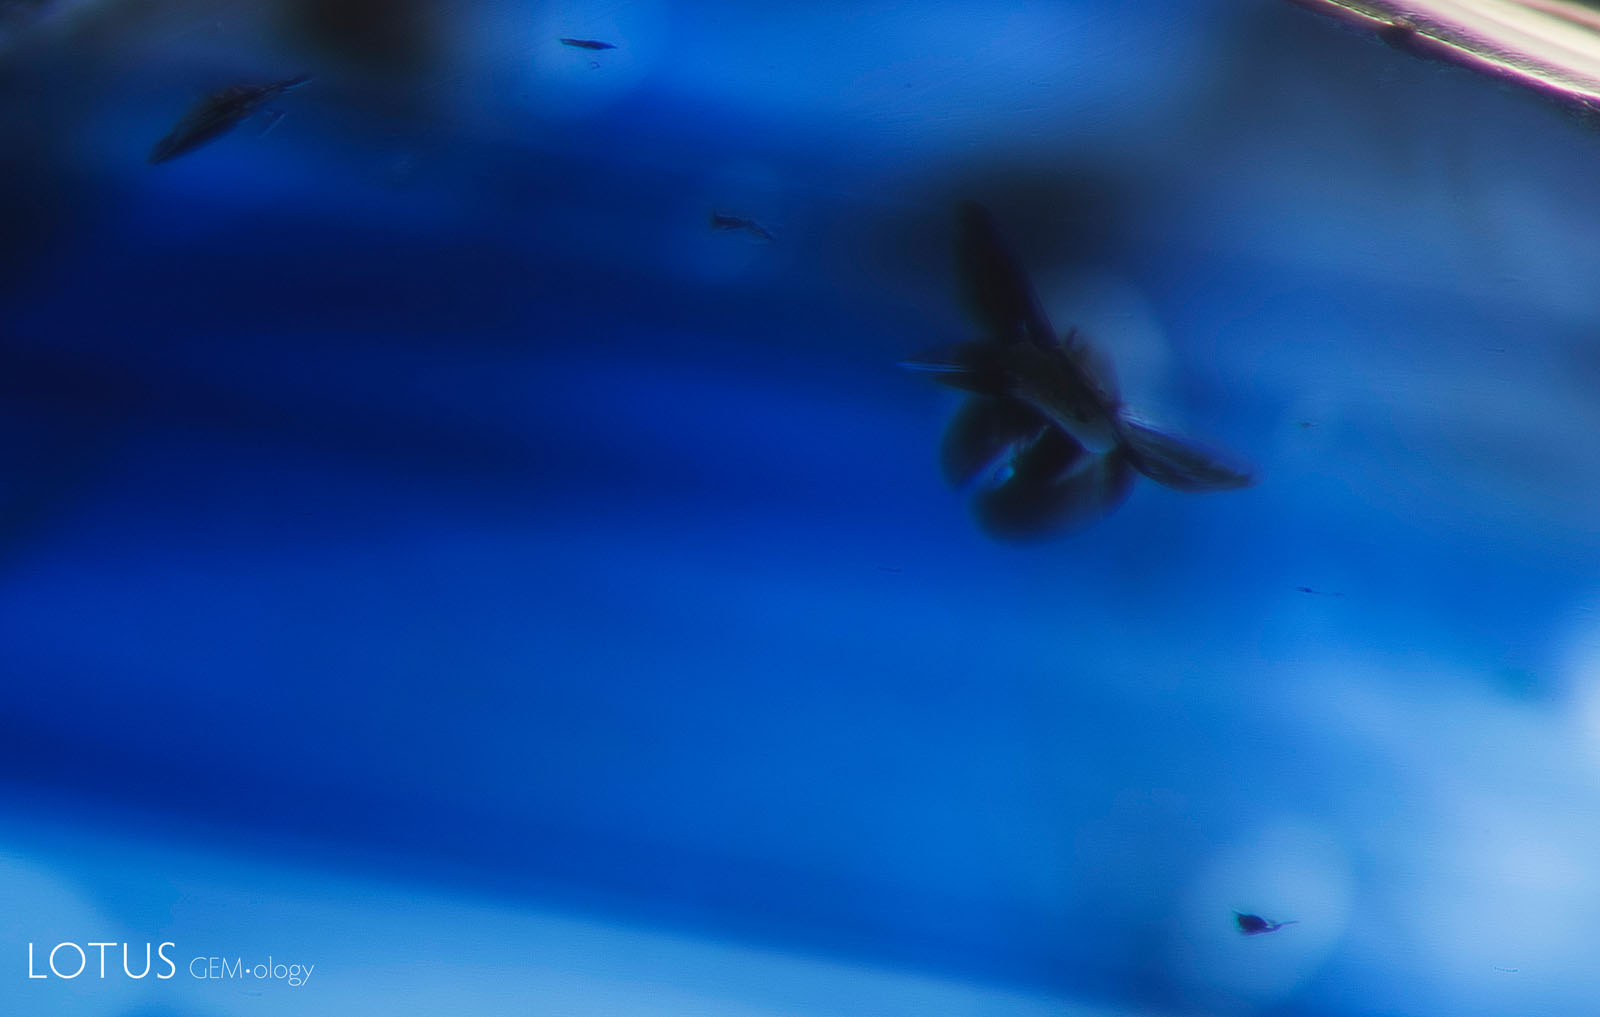 |
B. 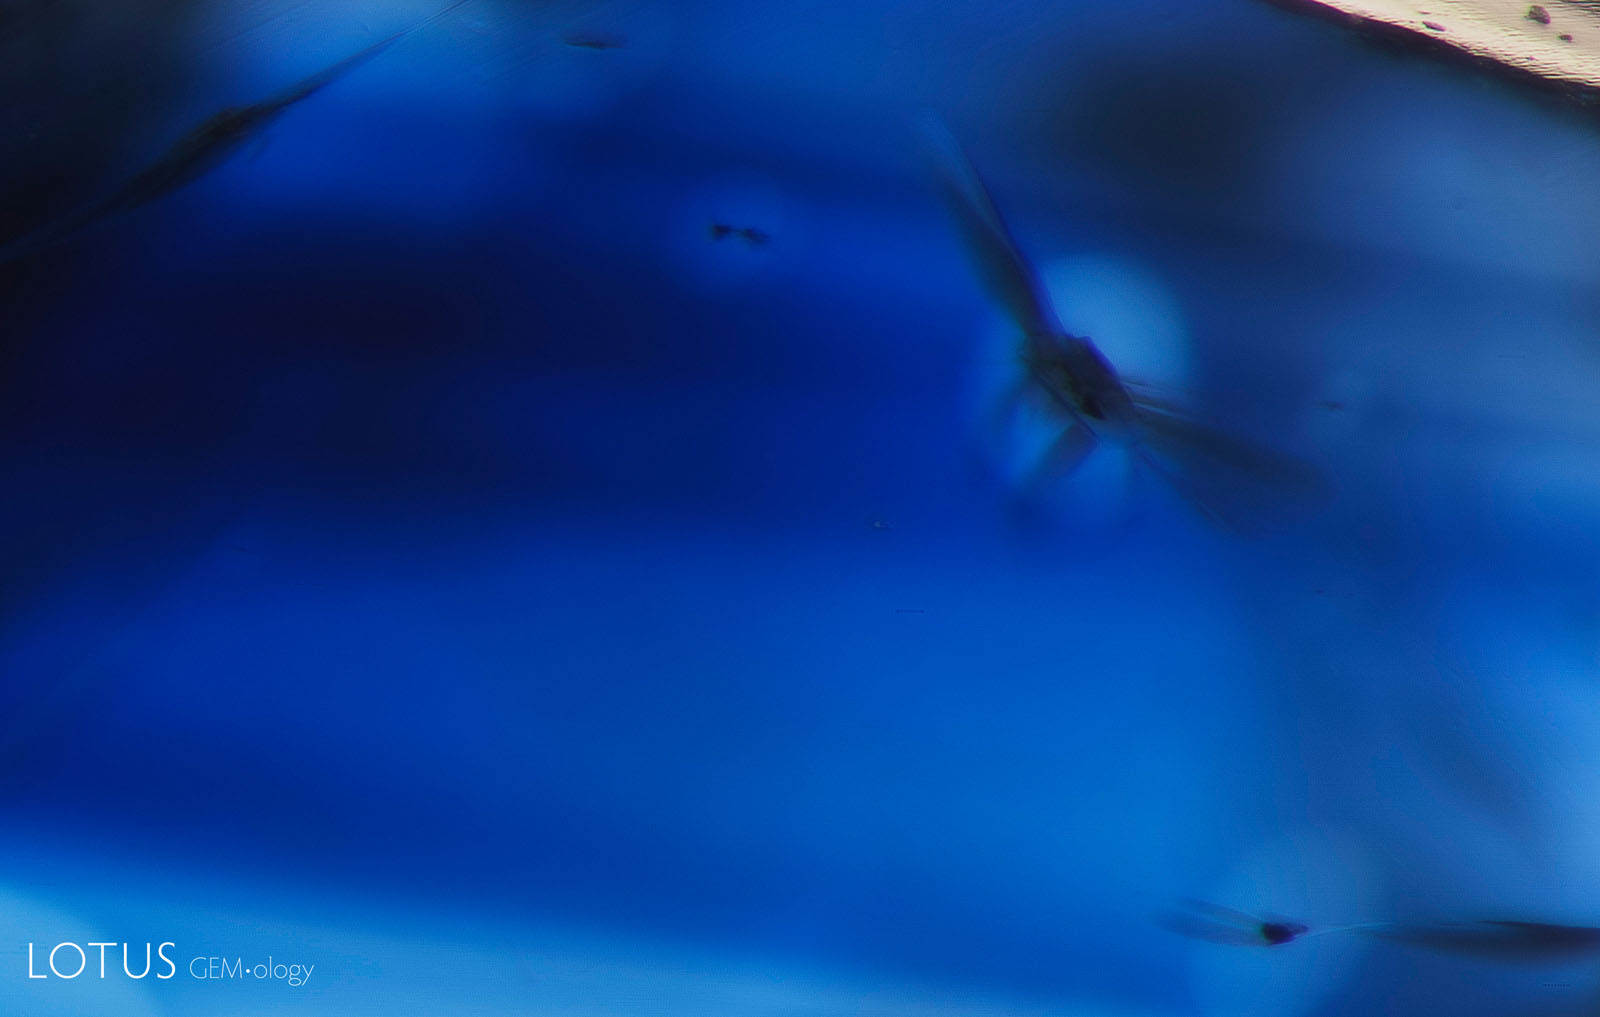 |
C. 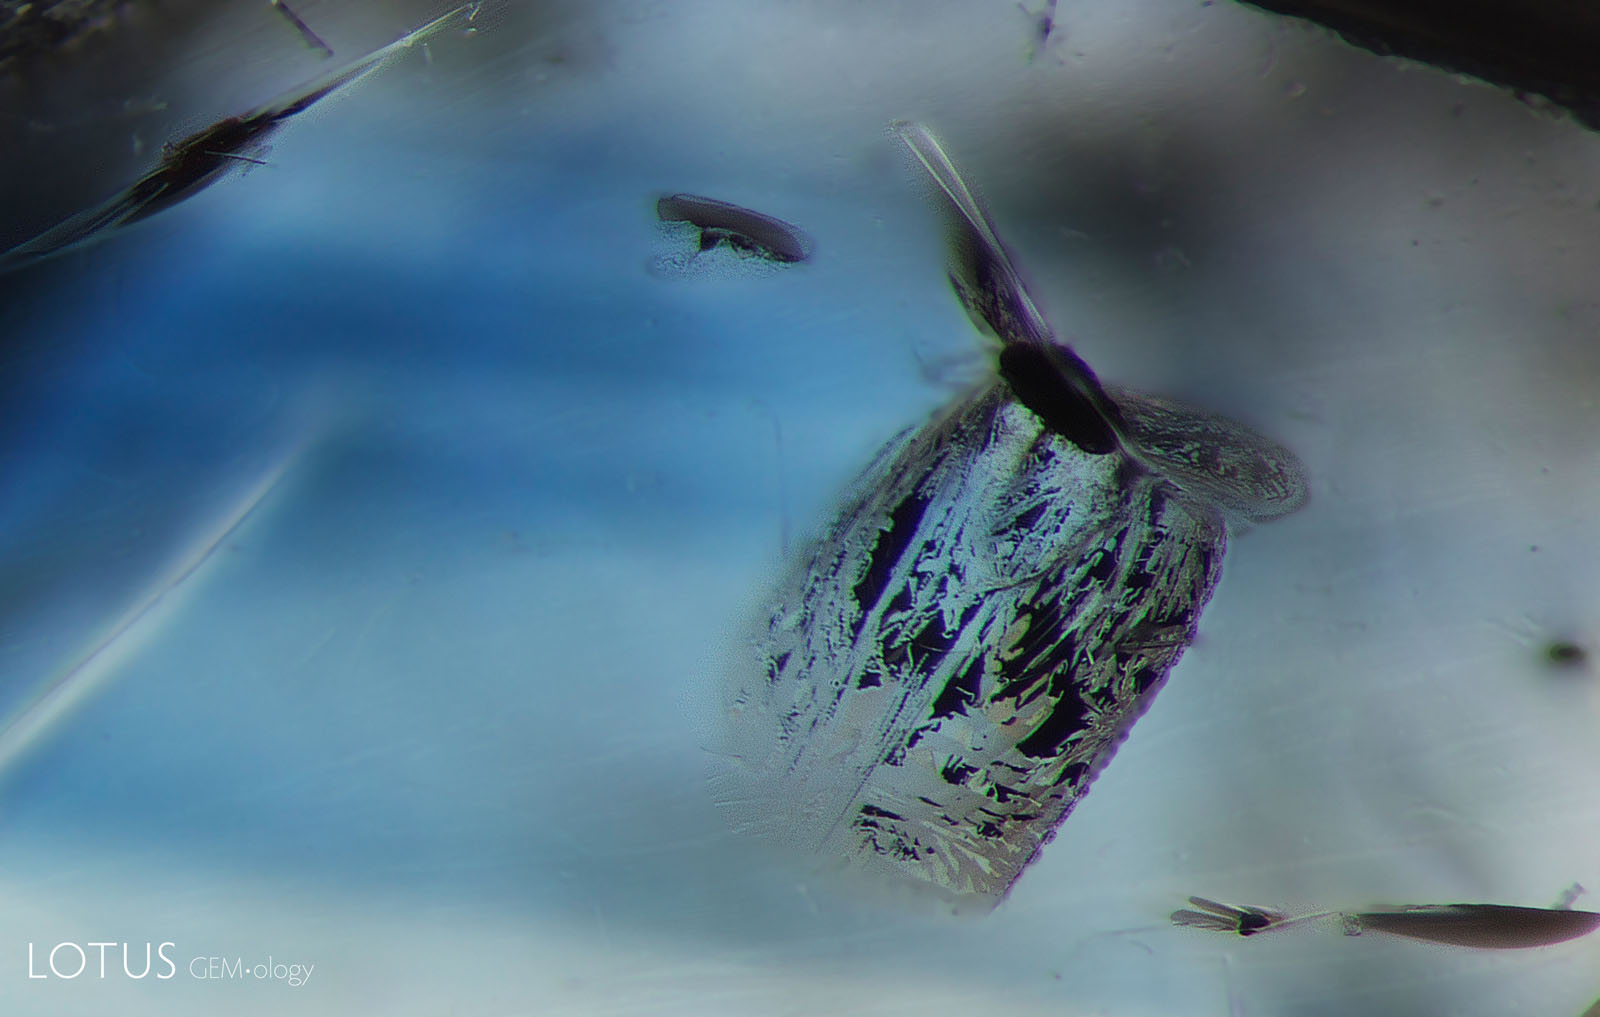 |
|
Figure 7. Heating of a Madagascar sapphire |
||
A. 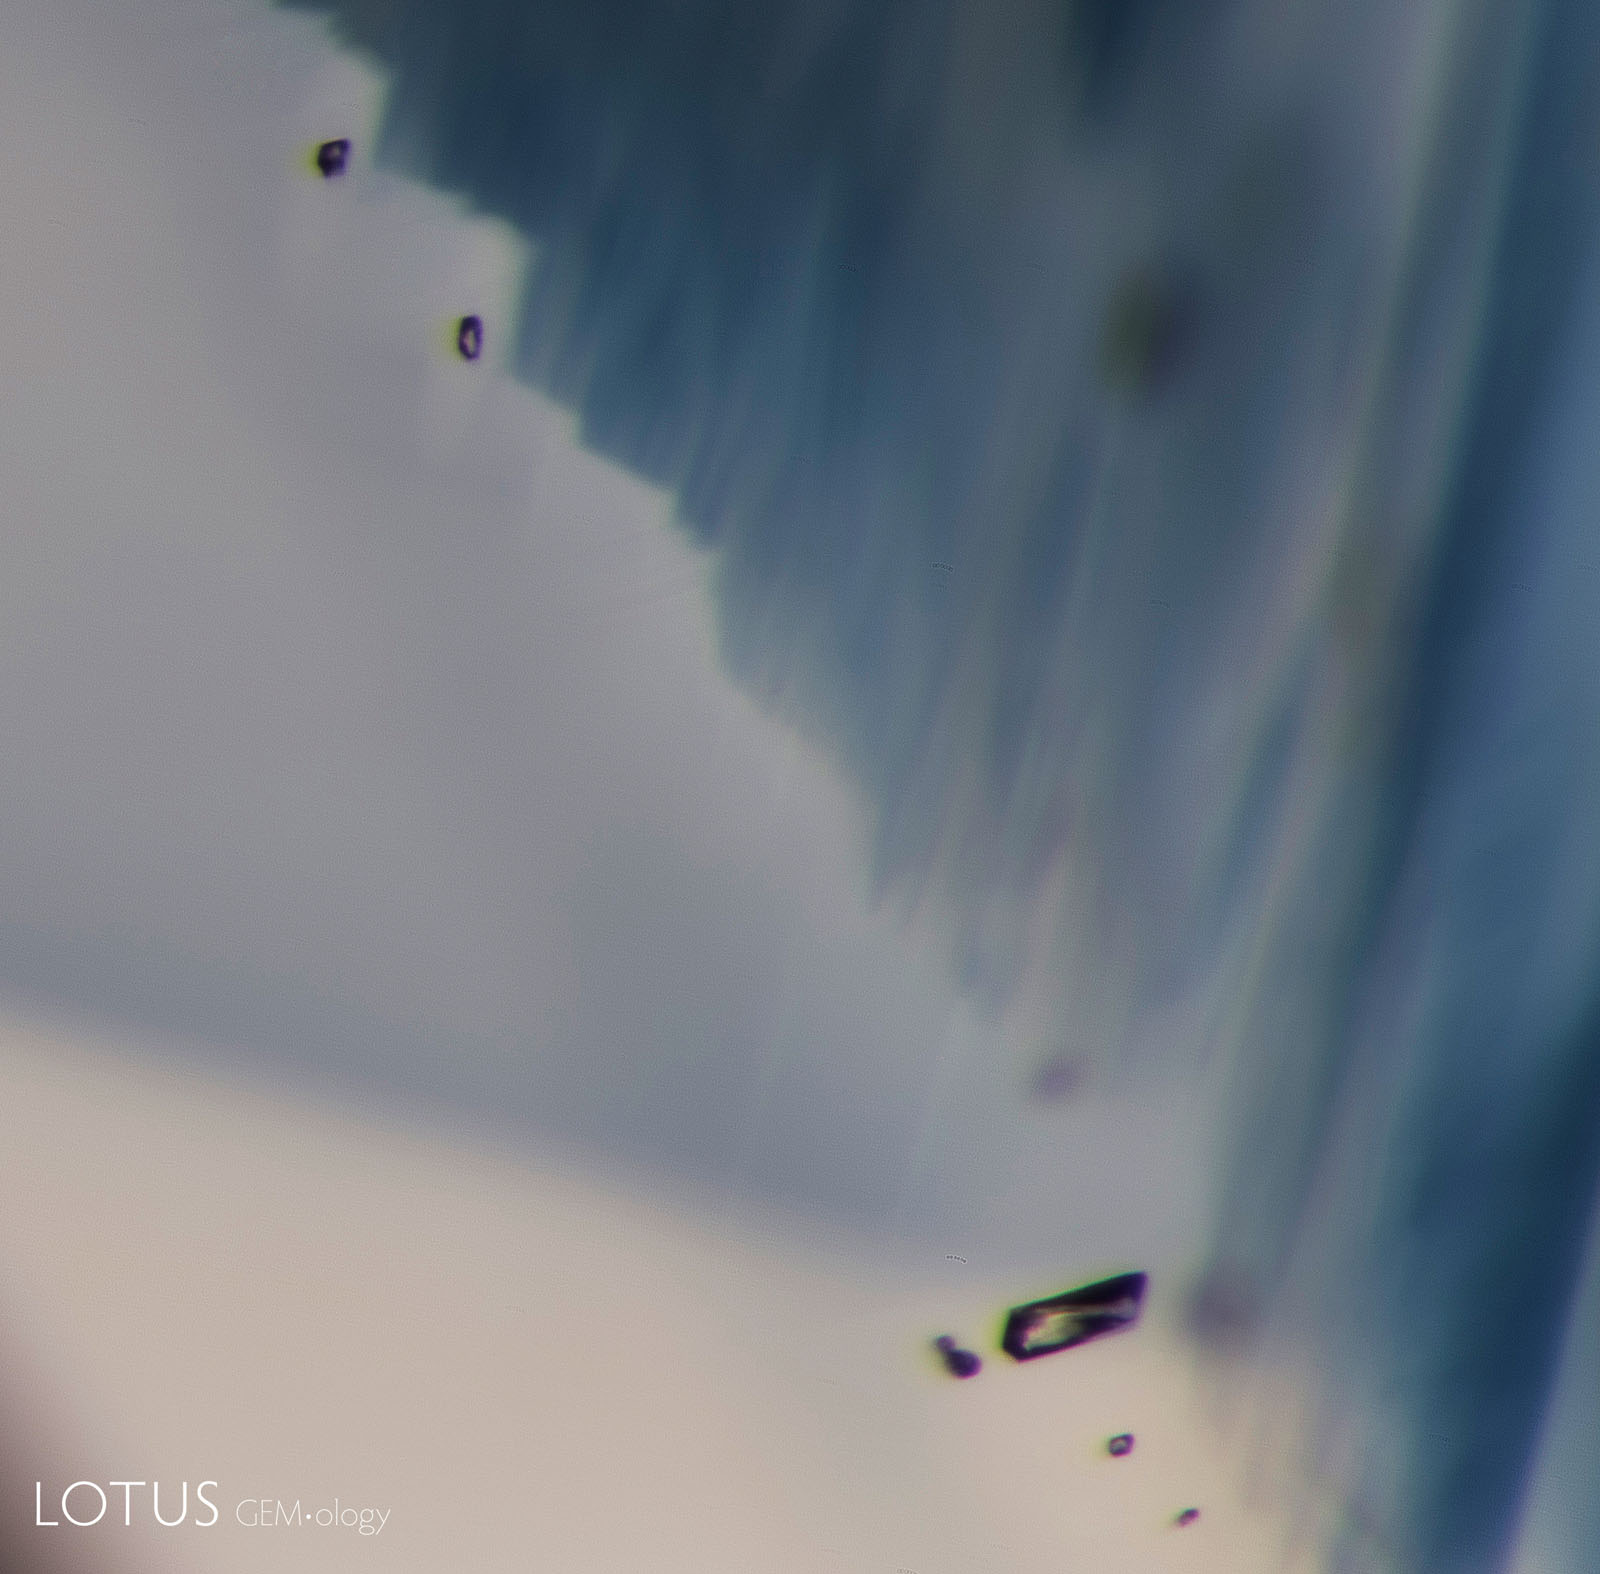 |
B. 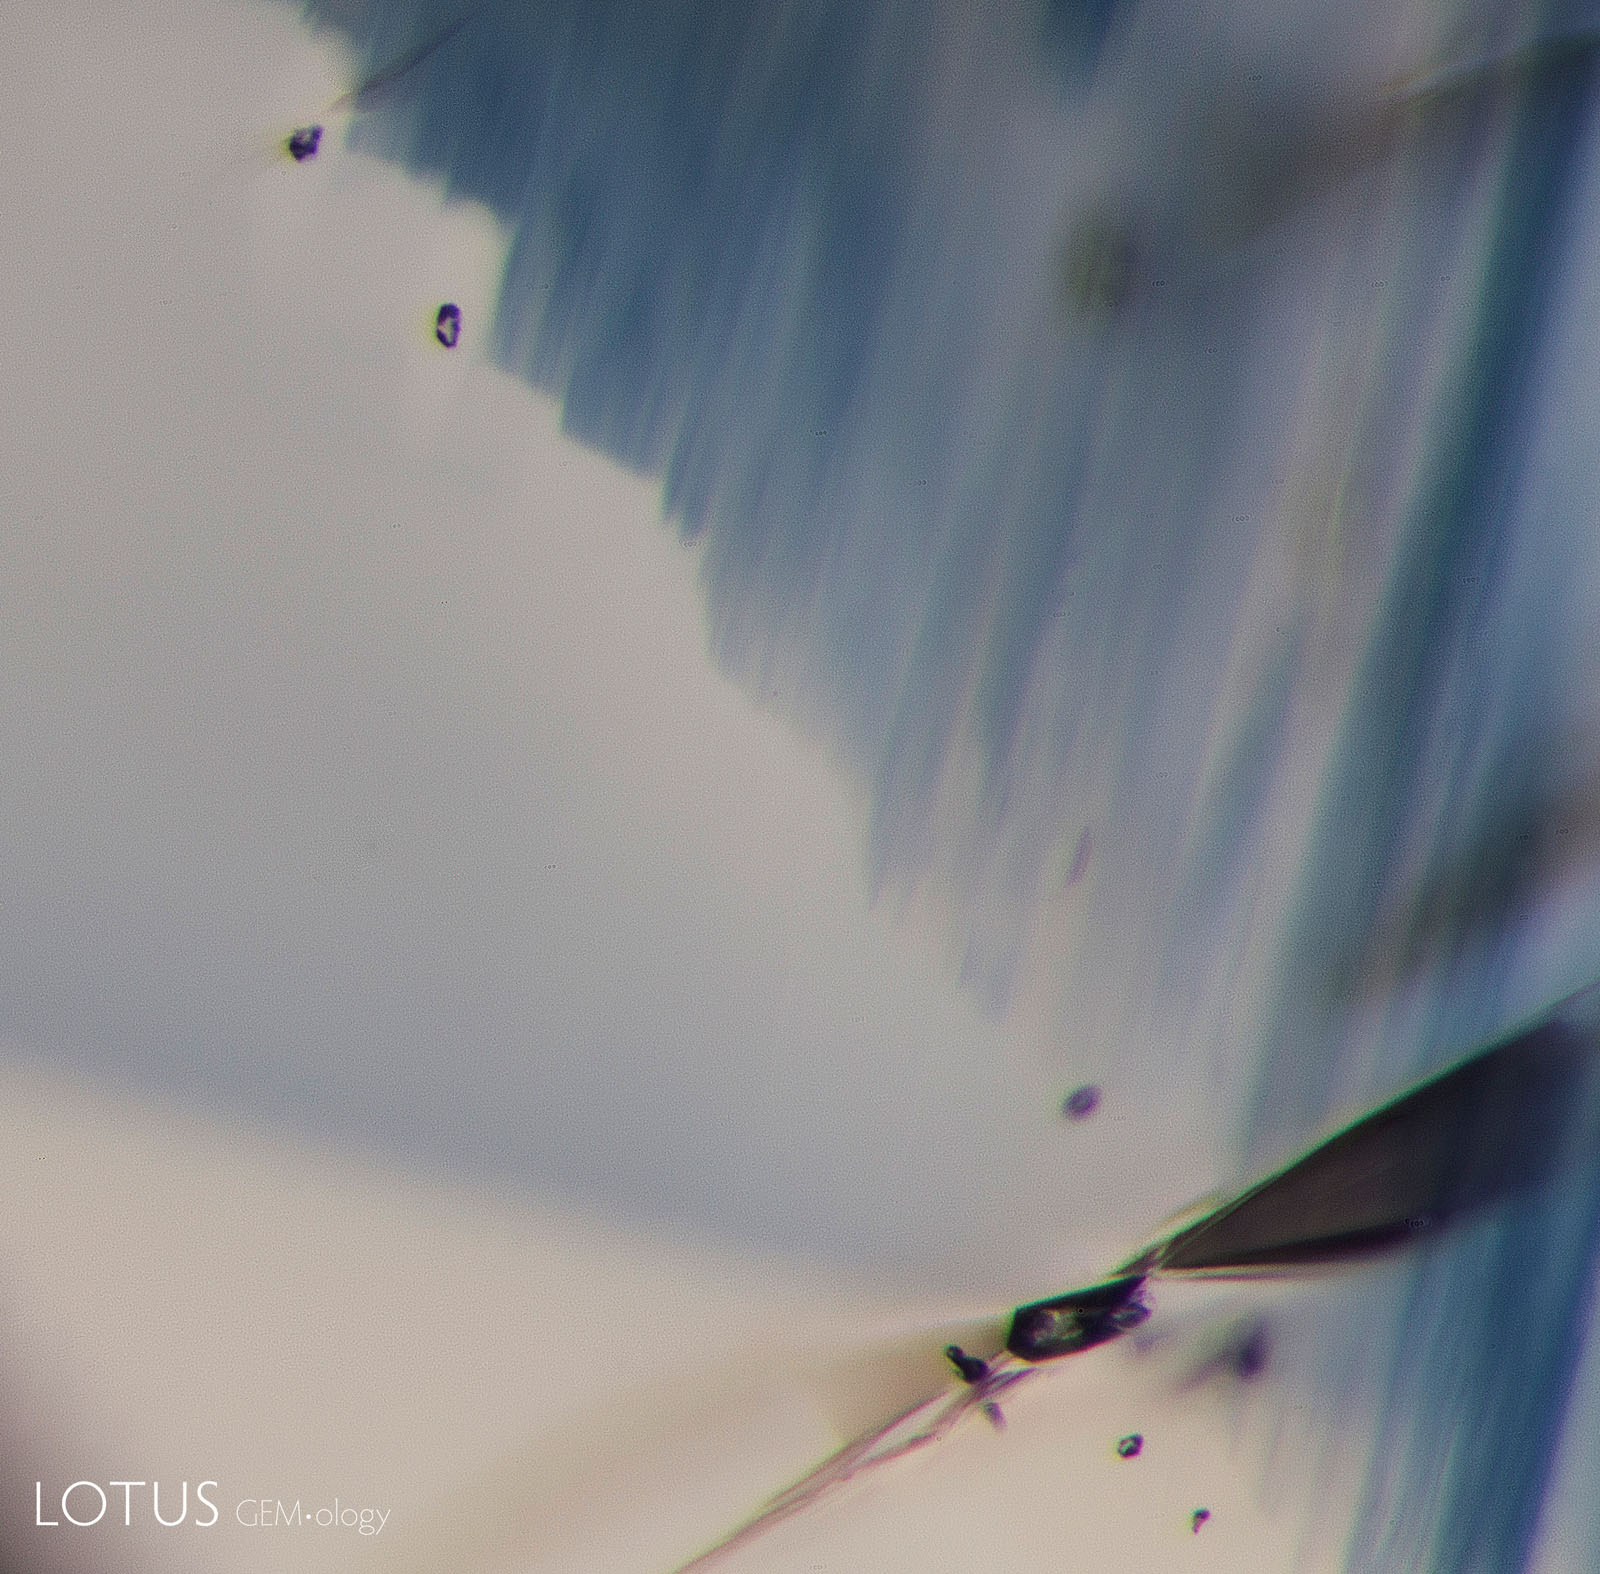 |
>C. 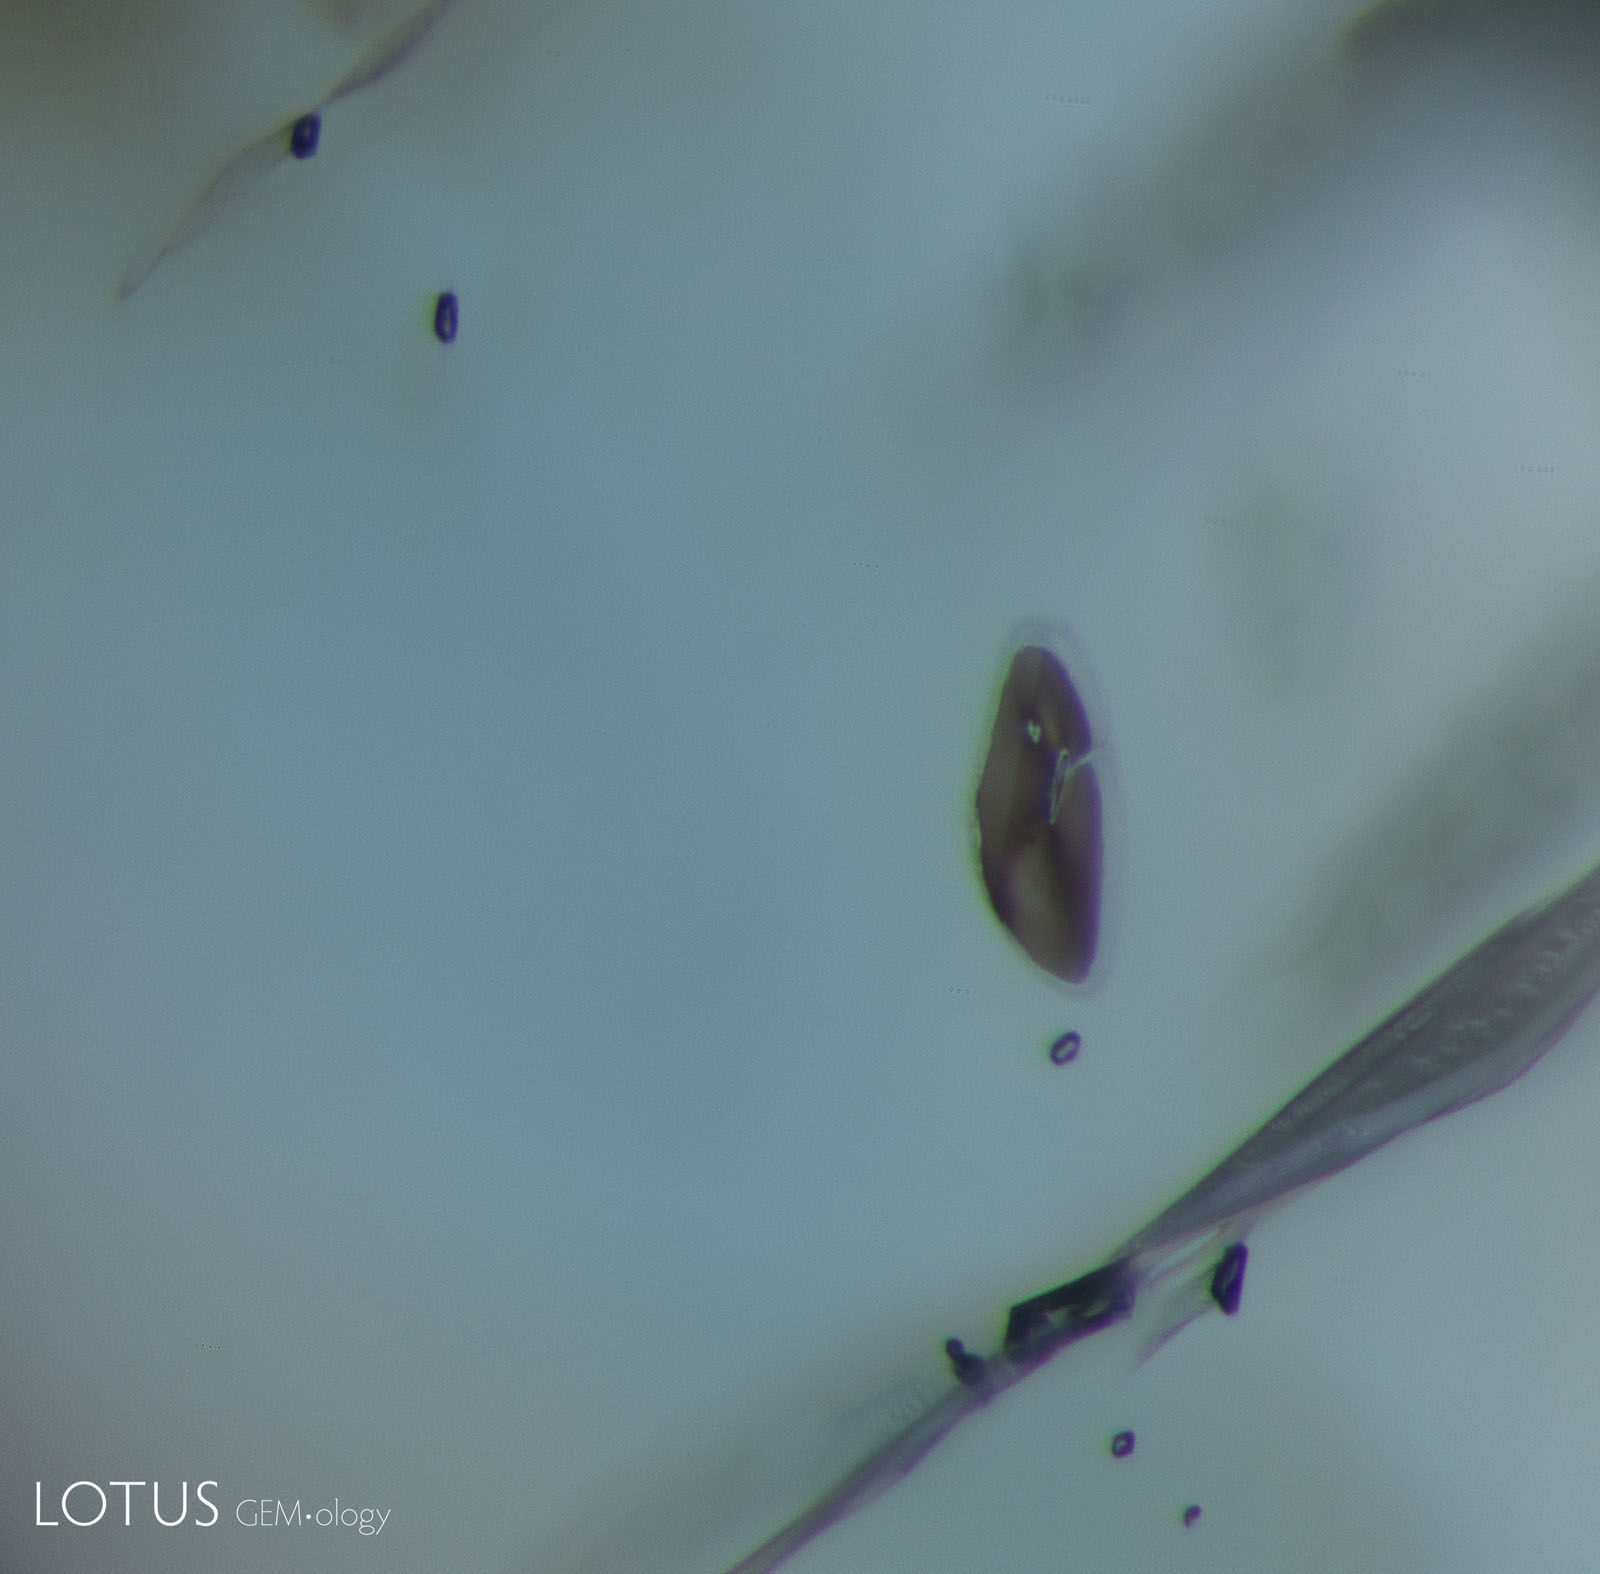 |
|
Figure 8. Heating of a Madagascar sapphire |
||
A. 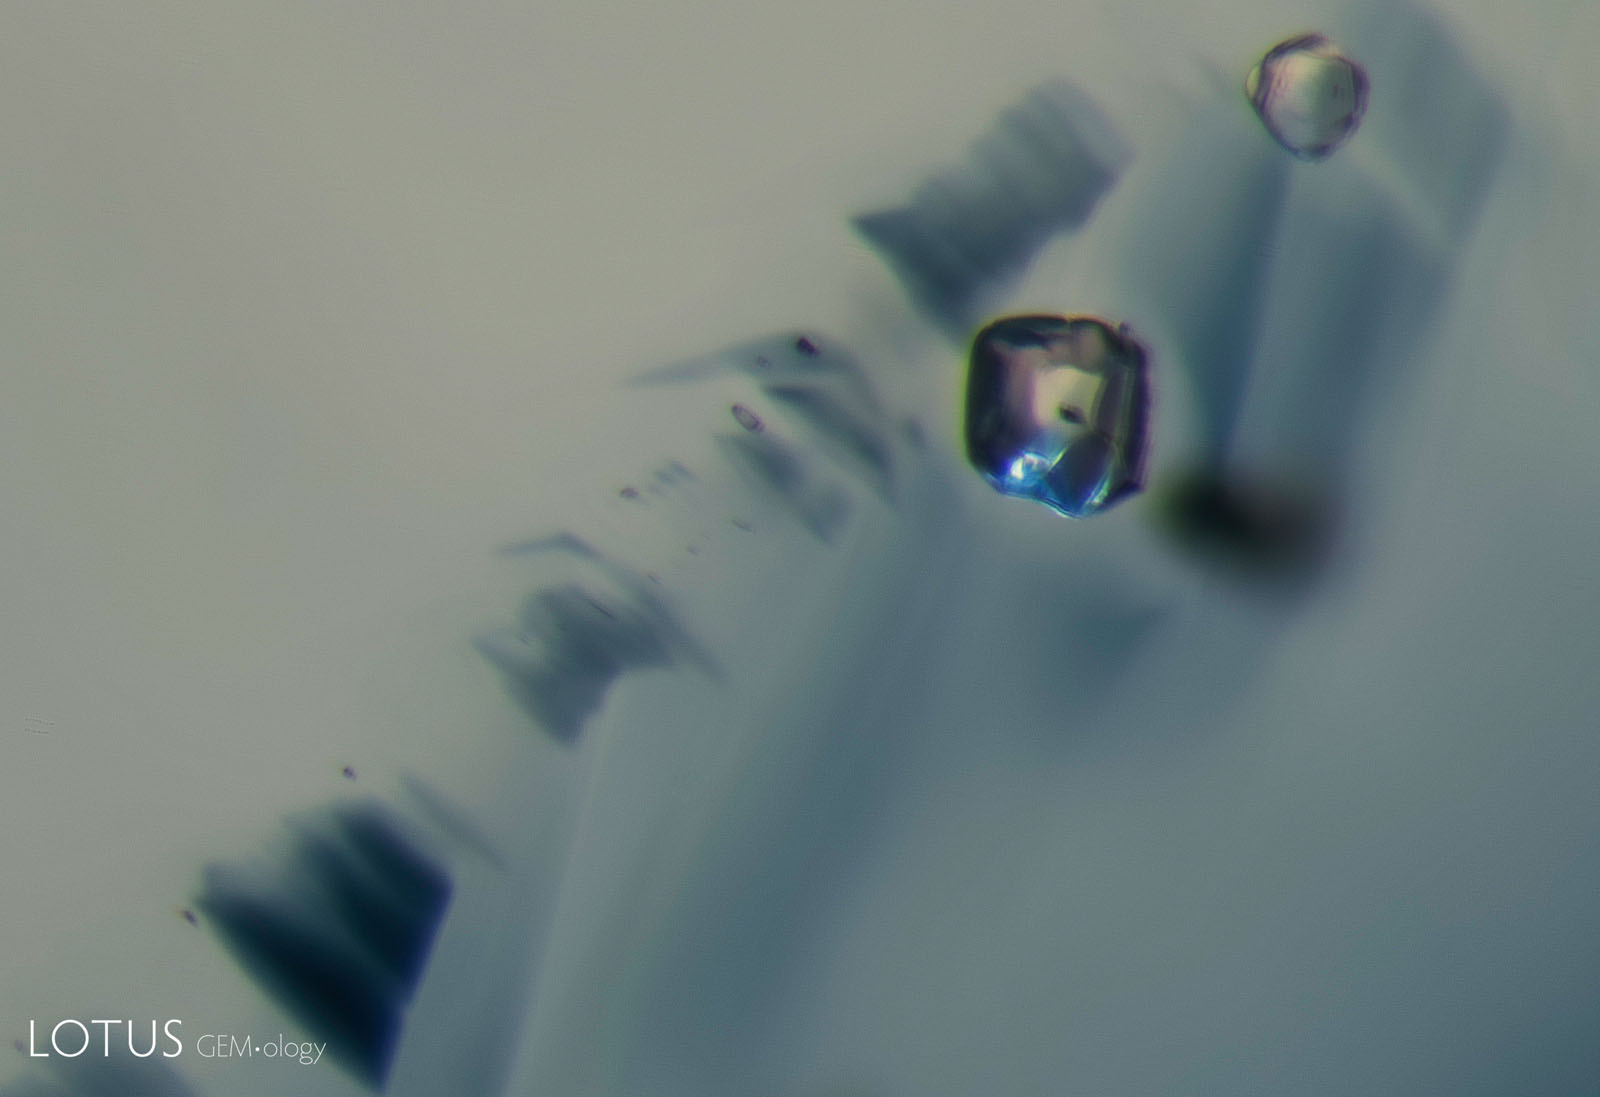 |
B. 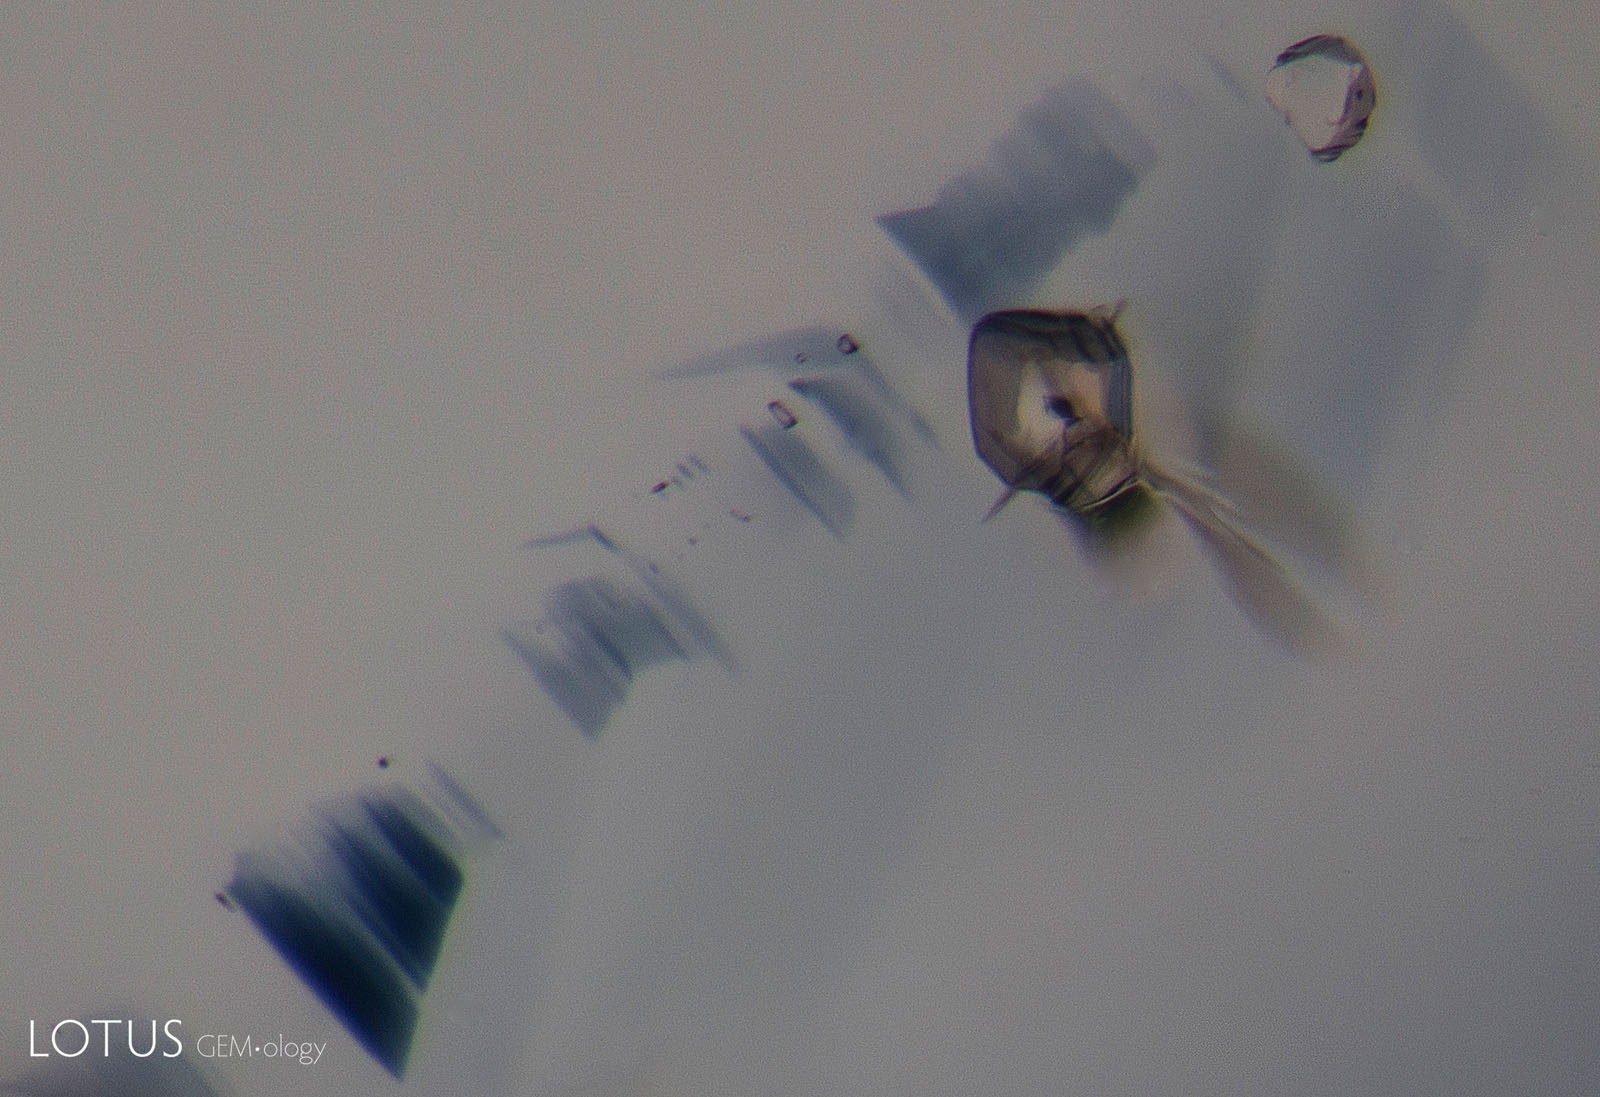 |
C.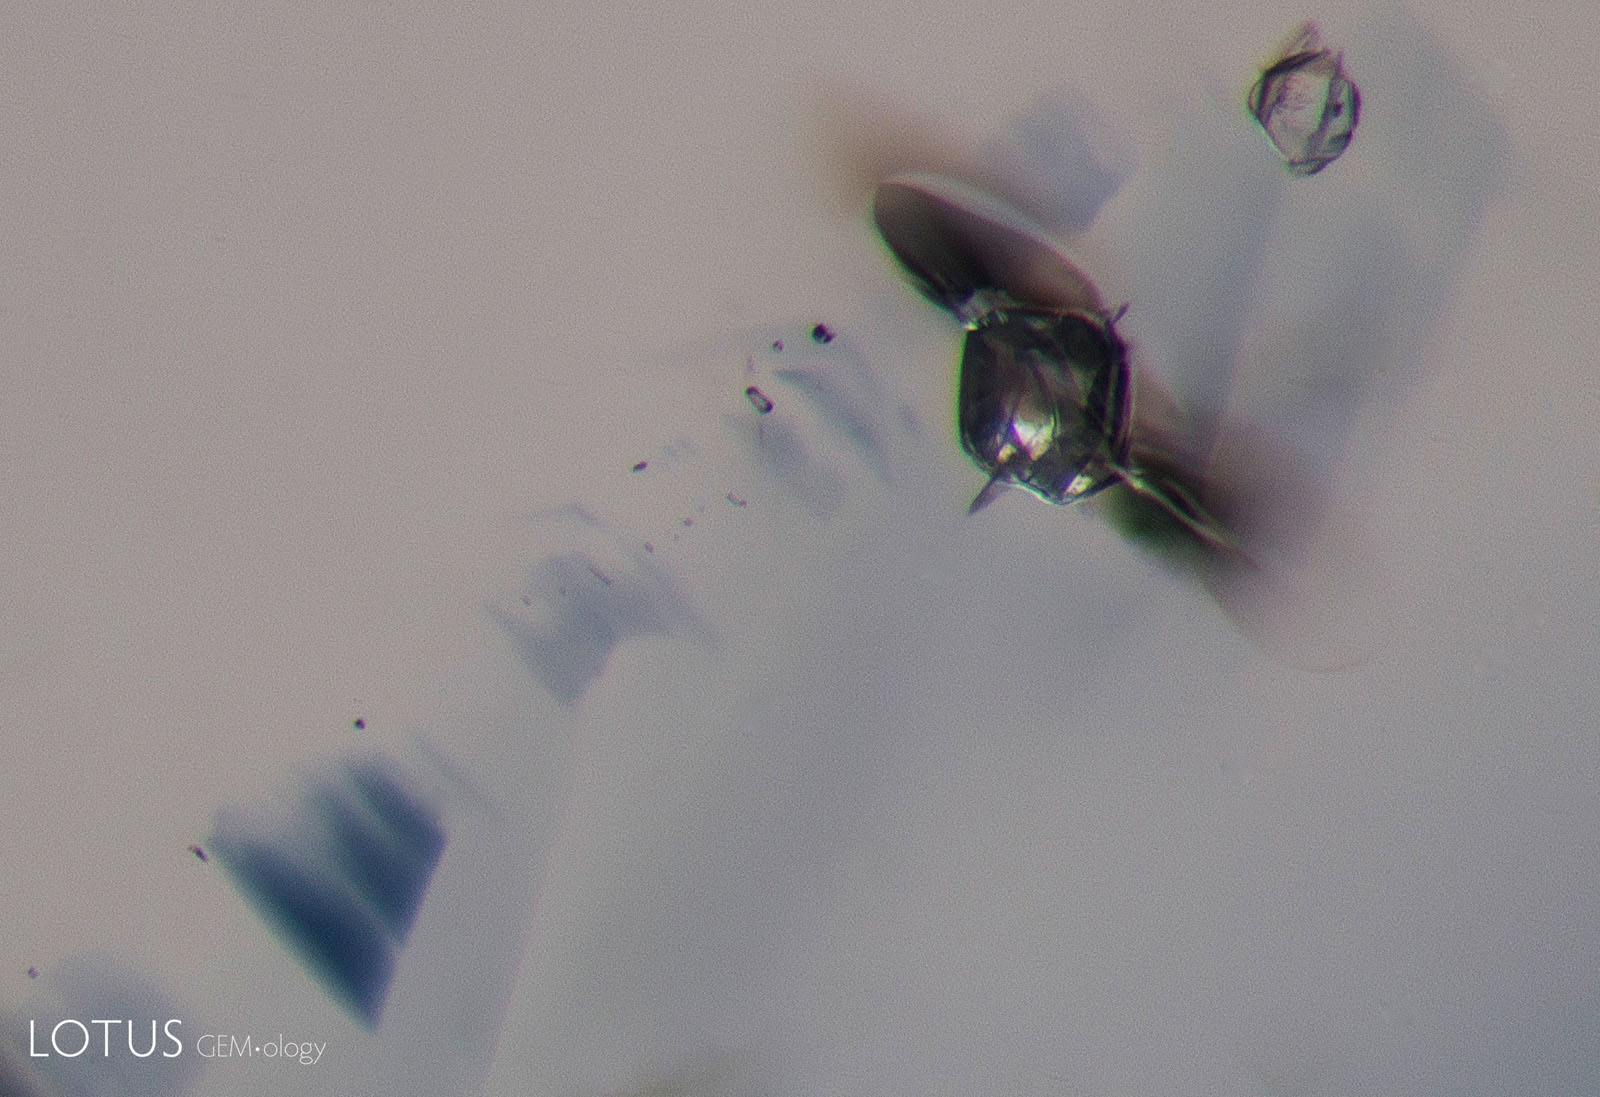 |
D. 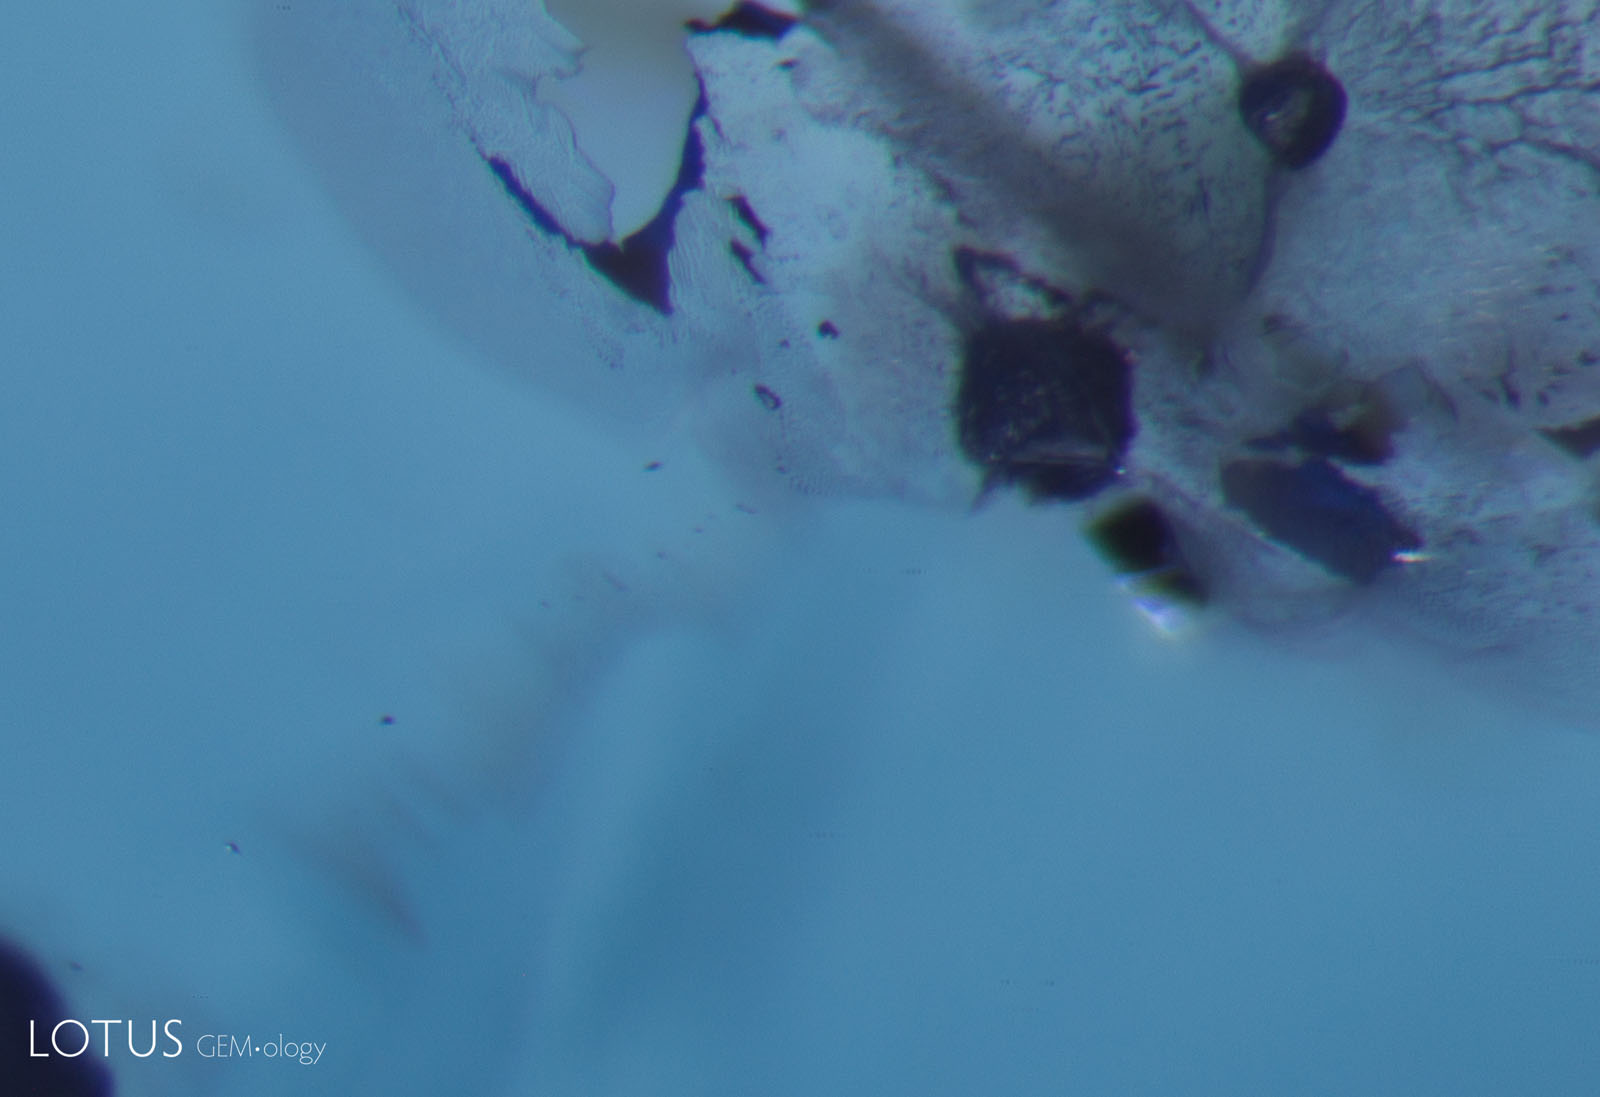 |
|
Figure 9. Heating of a Madagascar sapphire |
|
In several samples, the included crystals changed in appearance after heat. The crystals in sample 10, for example, developed small bubbles inside (see figure 10). Several included crystals developed a “frosty” appearance where their surfaces became rough and lighter in color, recorded in figures 10 and 11.
A. 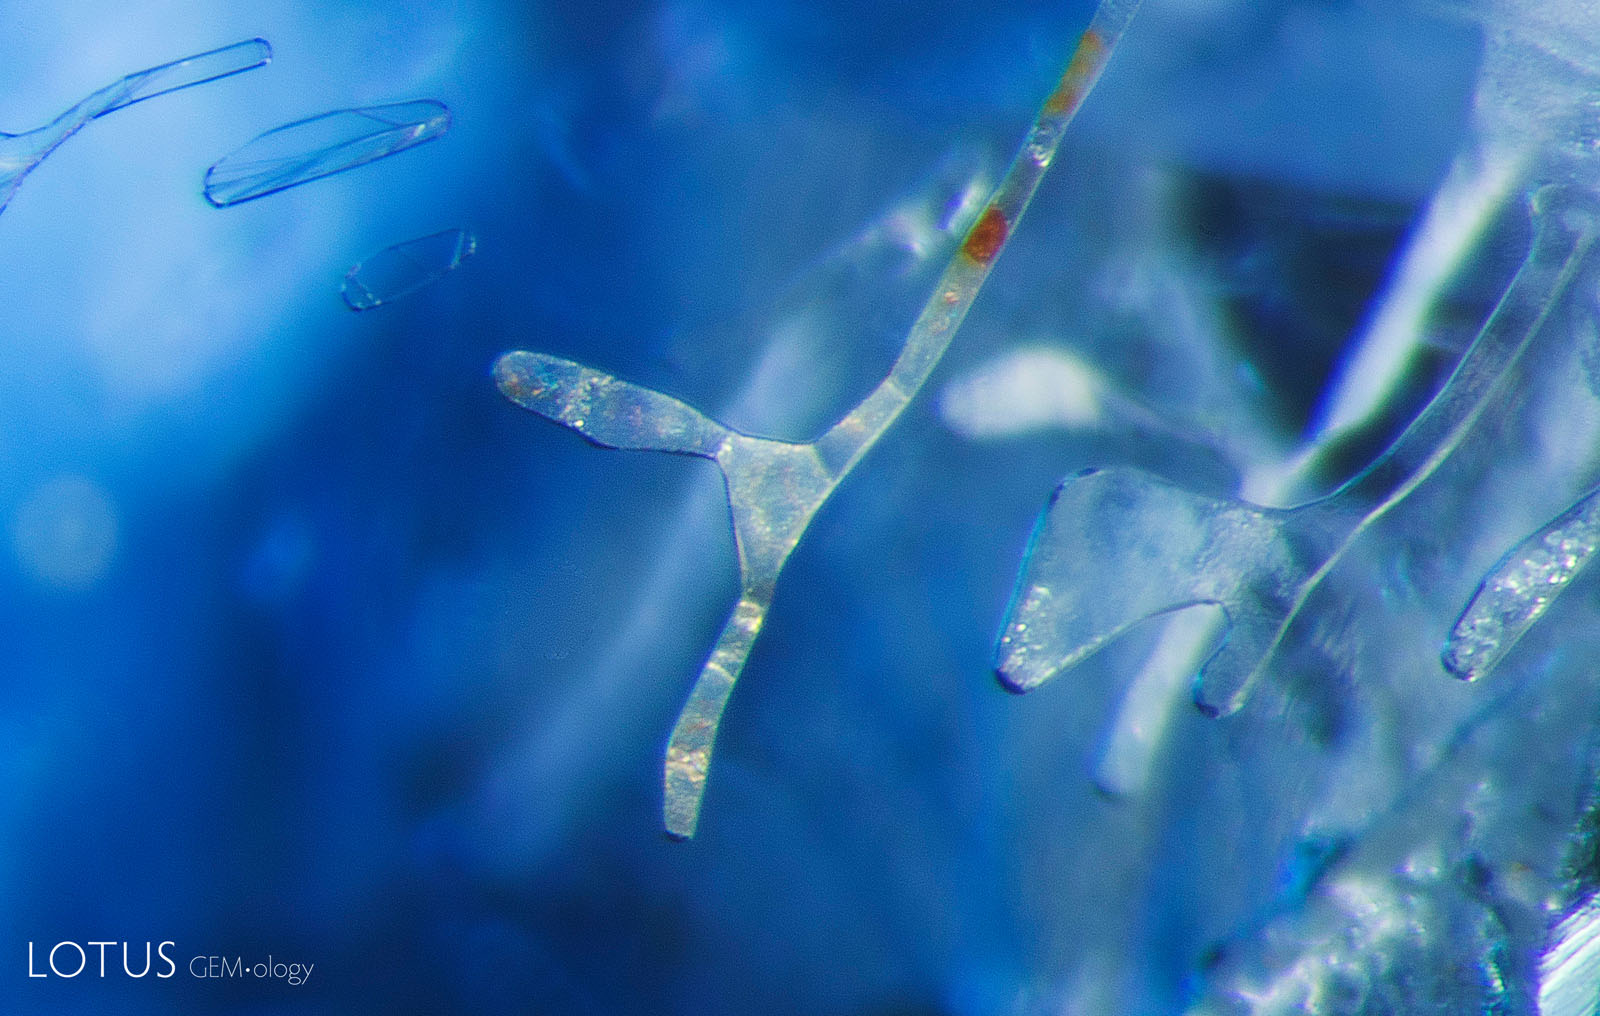 |
B. 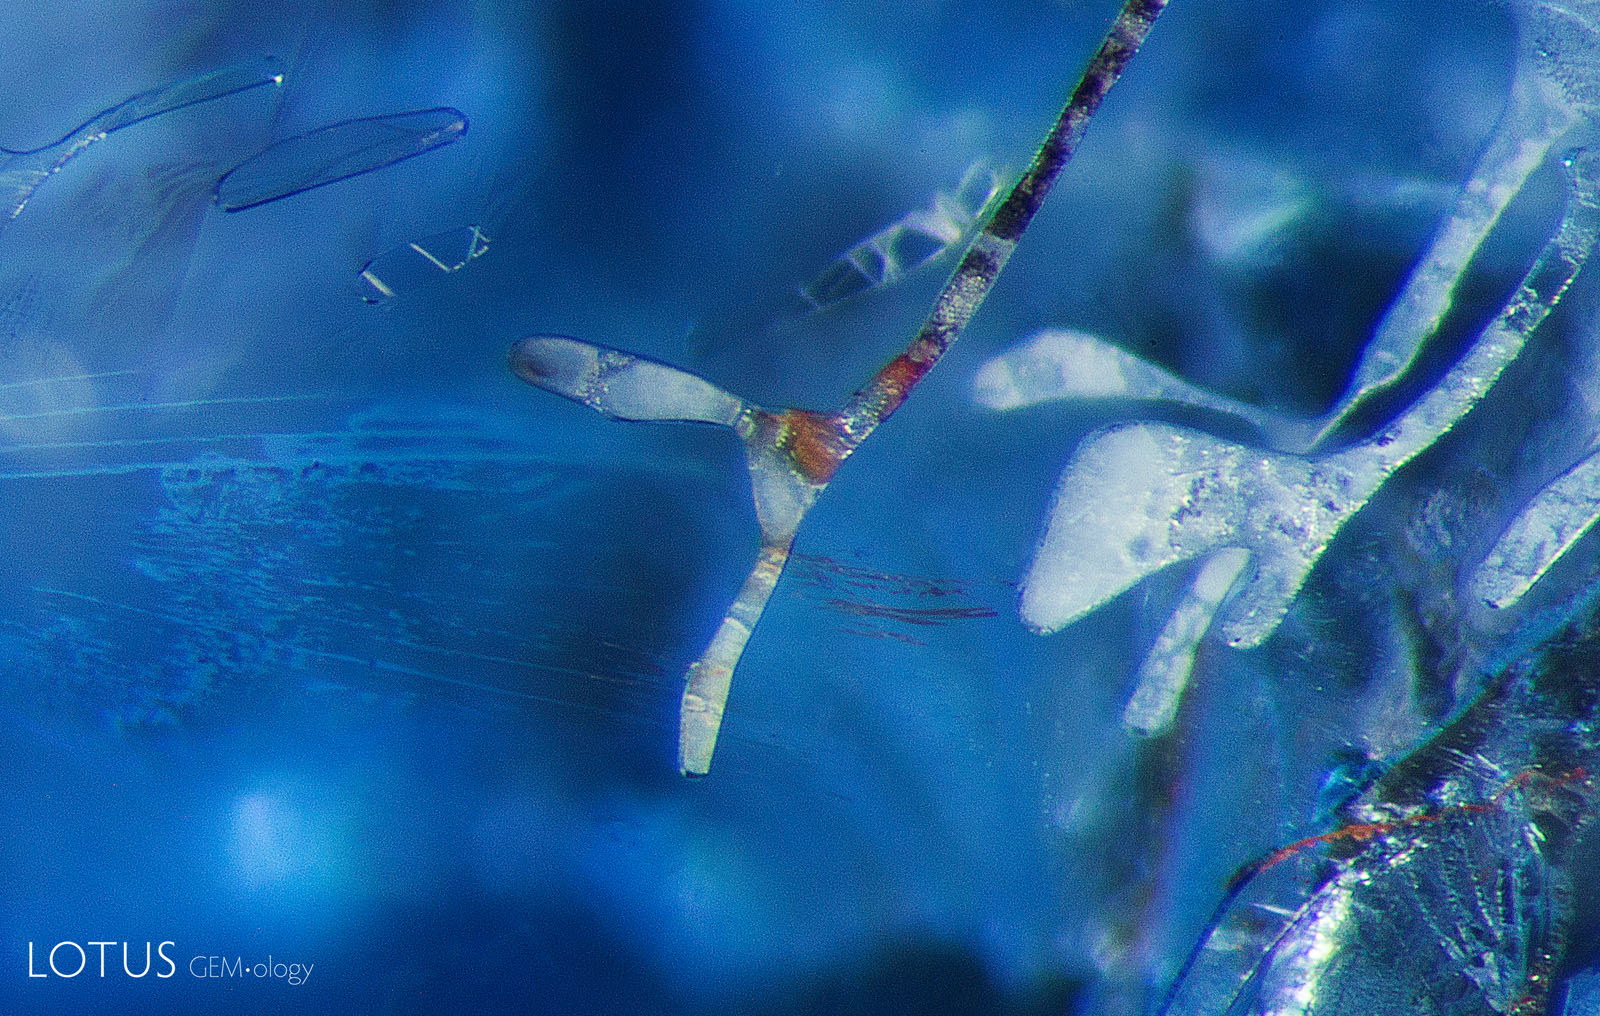 |
C.  |
|
Figure 10. Heating of a Madagascar sapphire |
||
A. 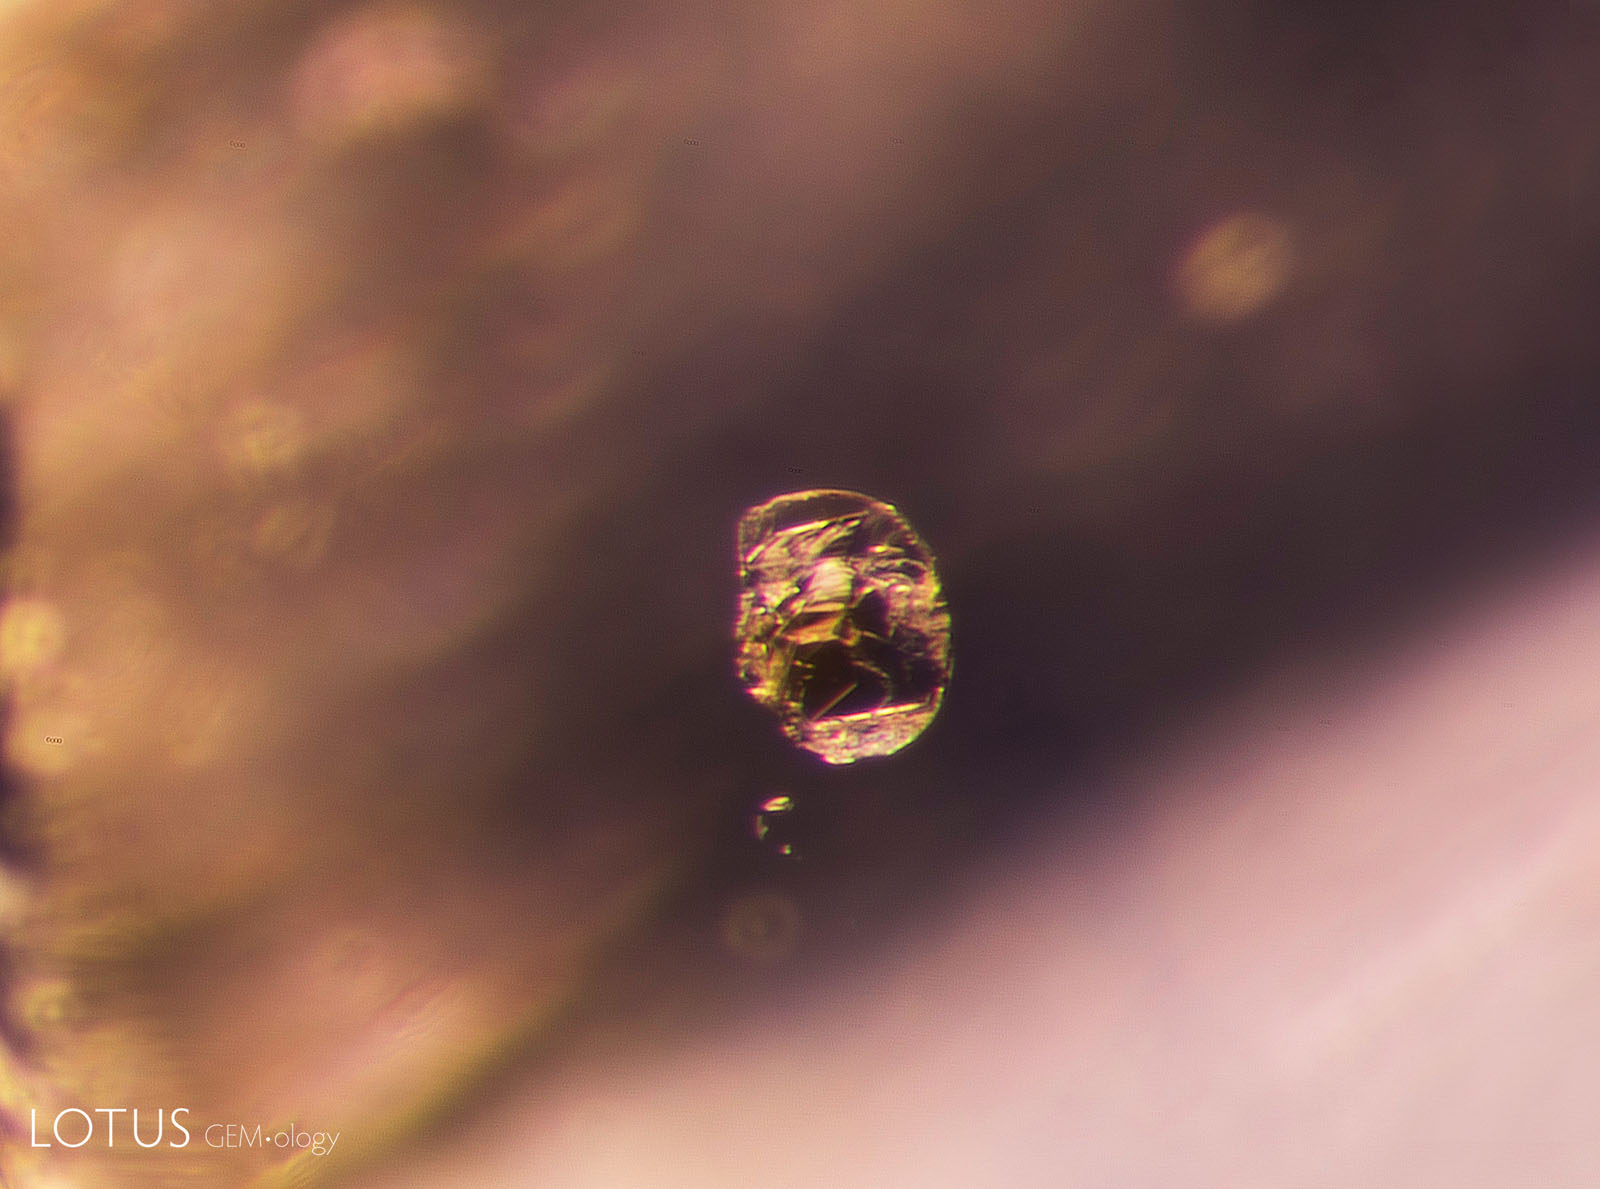 |
B. 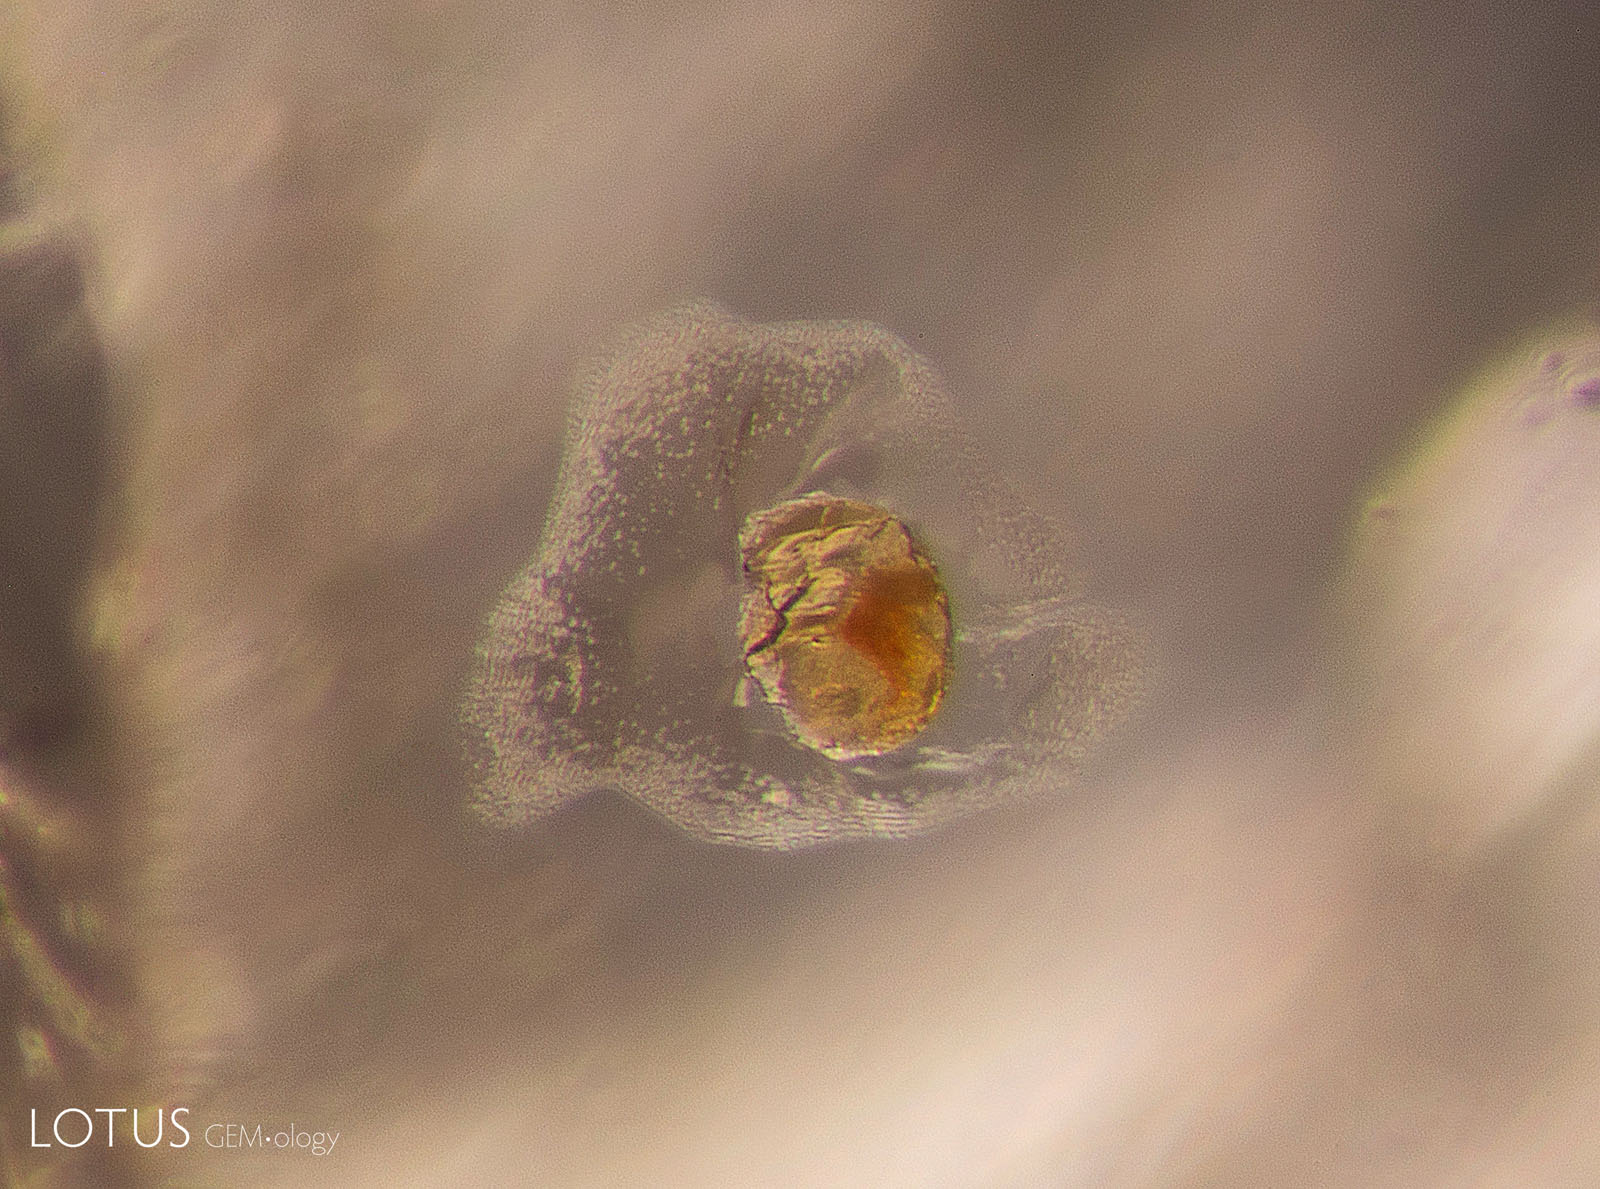 |
C. 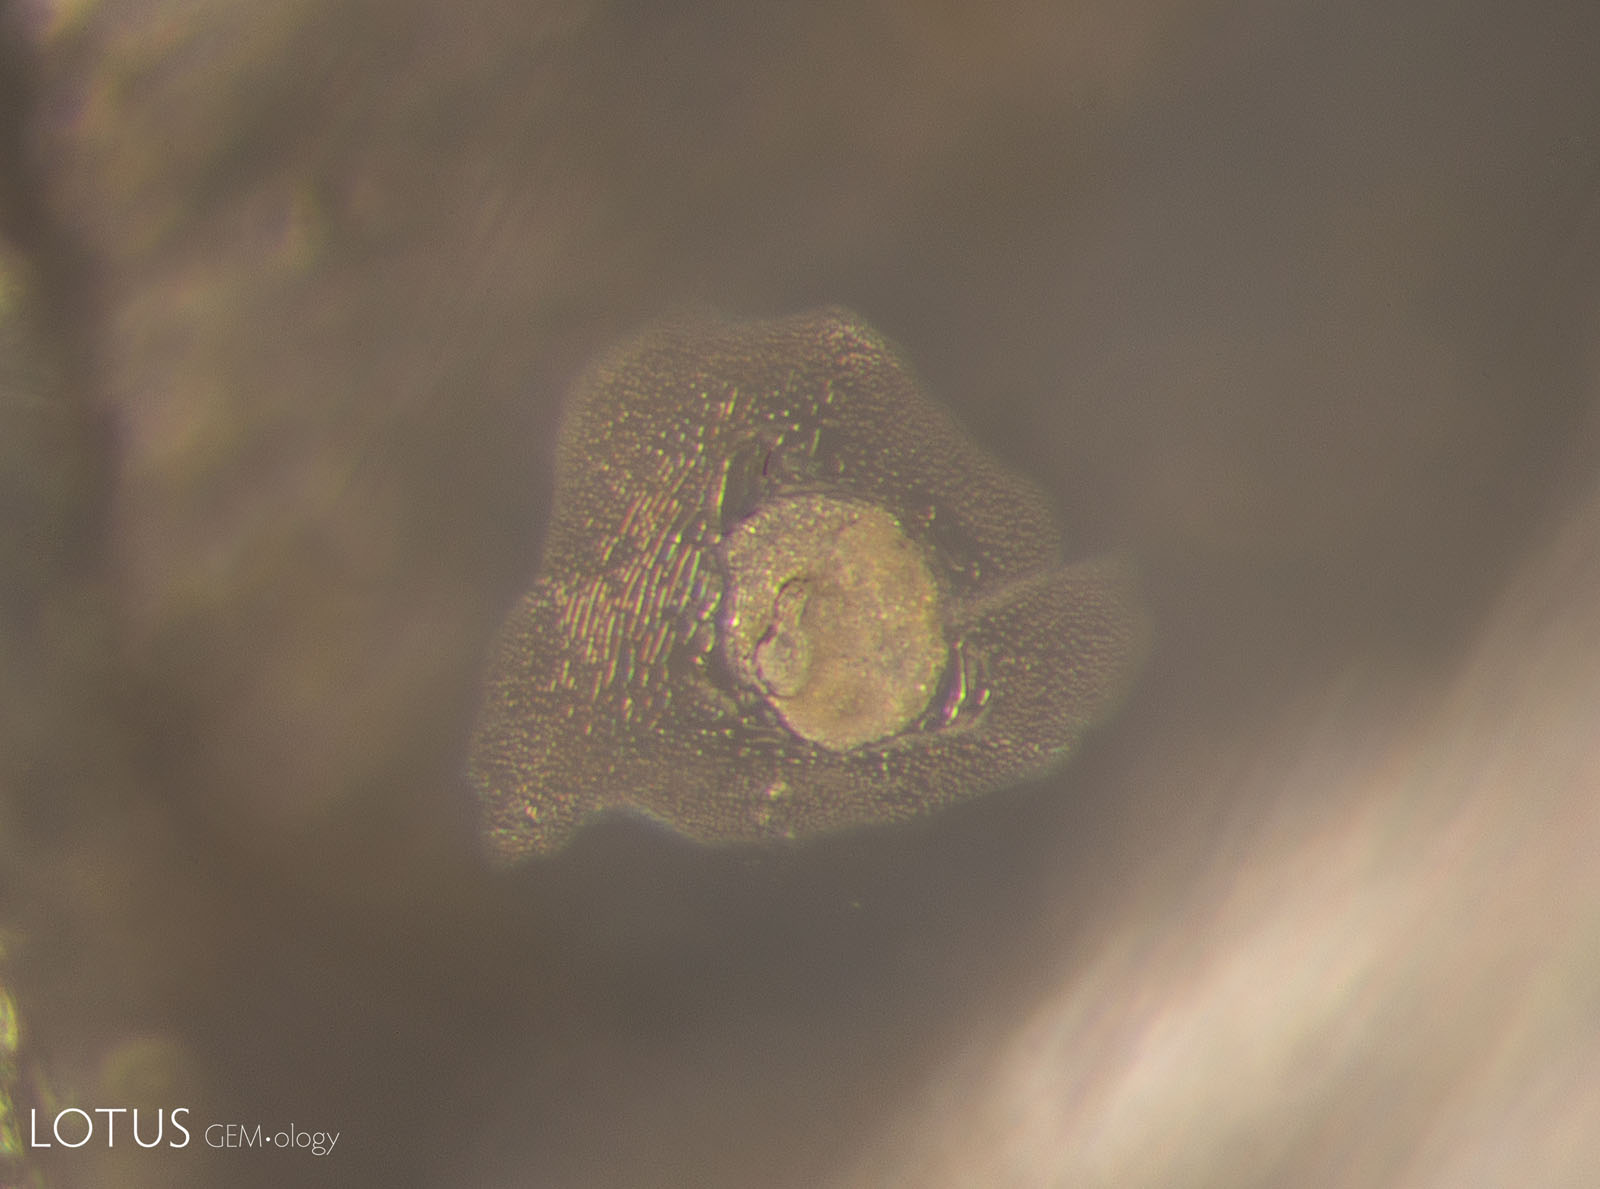 |
|
Figure 11. Heating of a Madagascar sapphire |
||
Figures 6–11 show a selection of inclusion photos of the stones both before and after heating. We kept the lighting conditions as similar as possible at each step, but because the bodycolor of the stones was changing, there are significant differences in the overall color of some images. In some cases, a blue color-correcting filter was used to neutralize the yellow tint of our microscope light.
UV-Vis-NIR
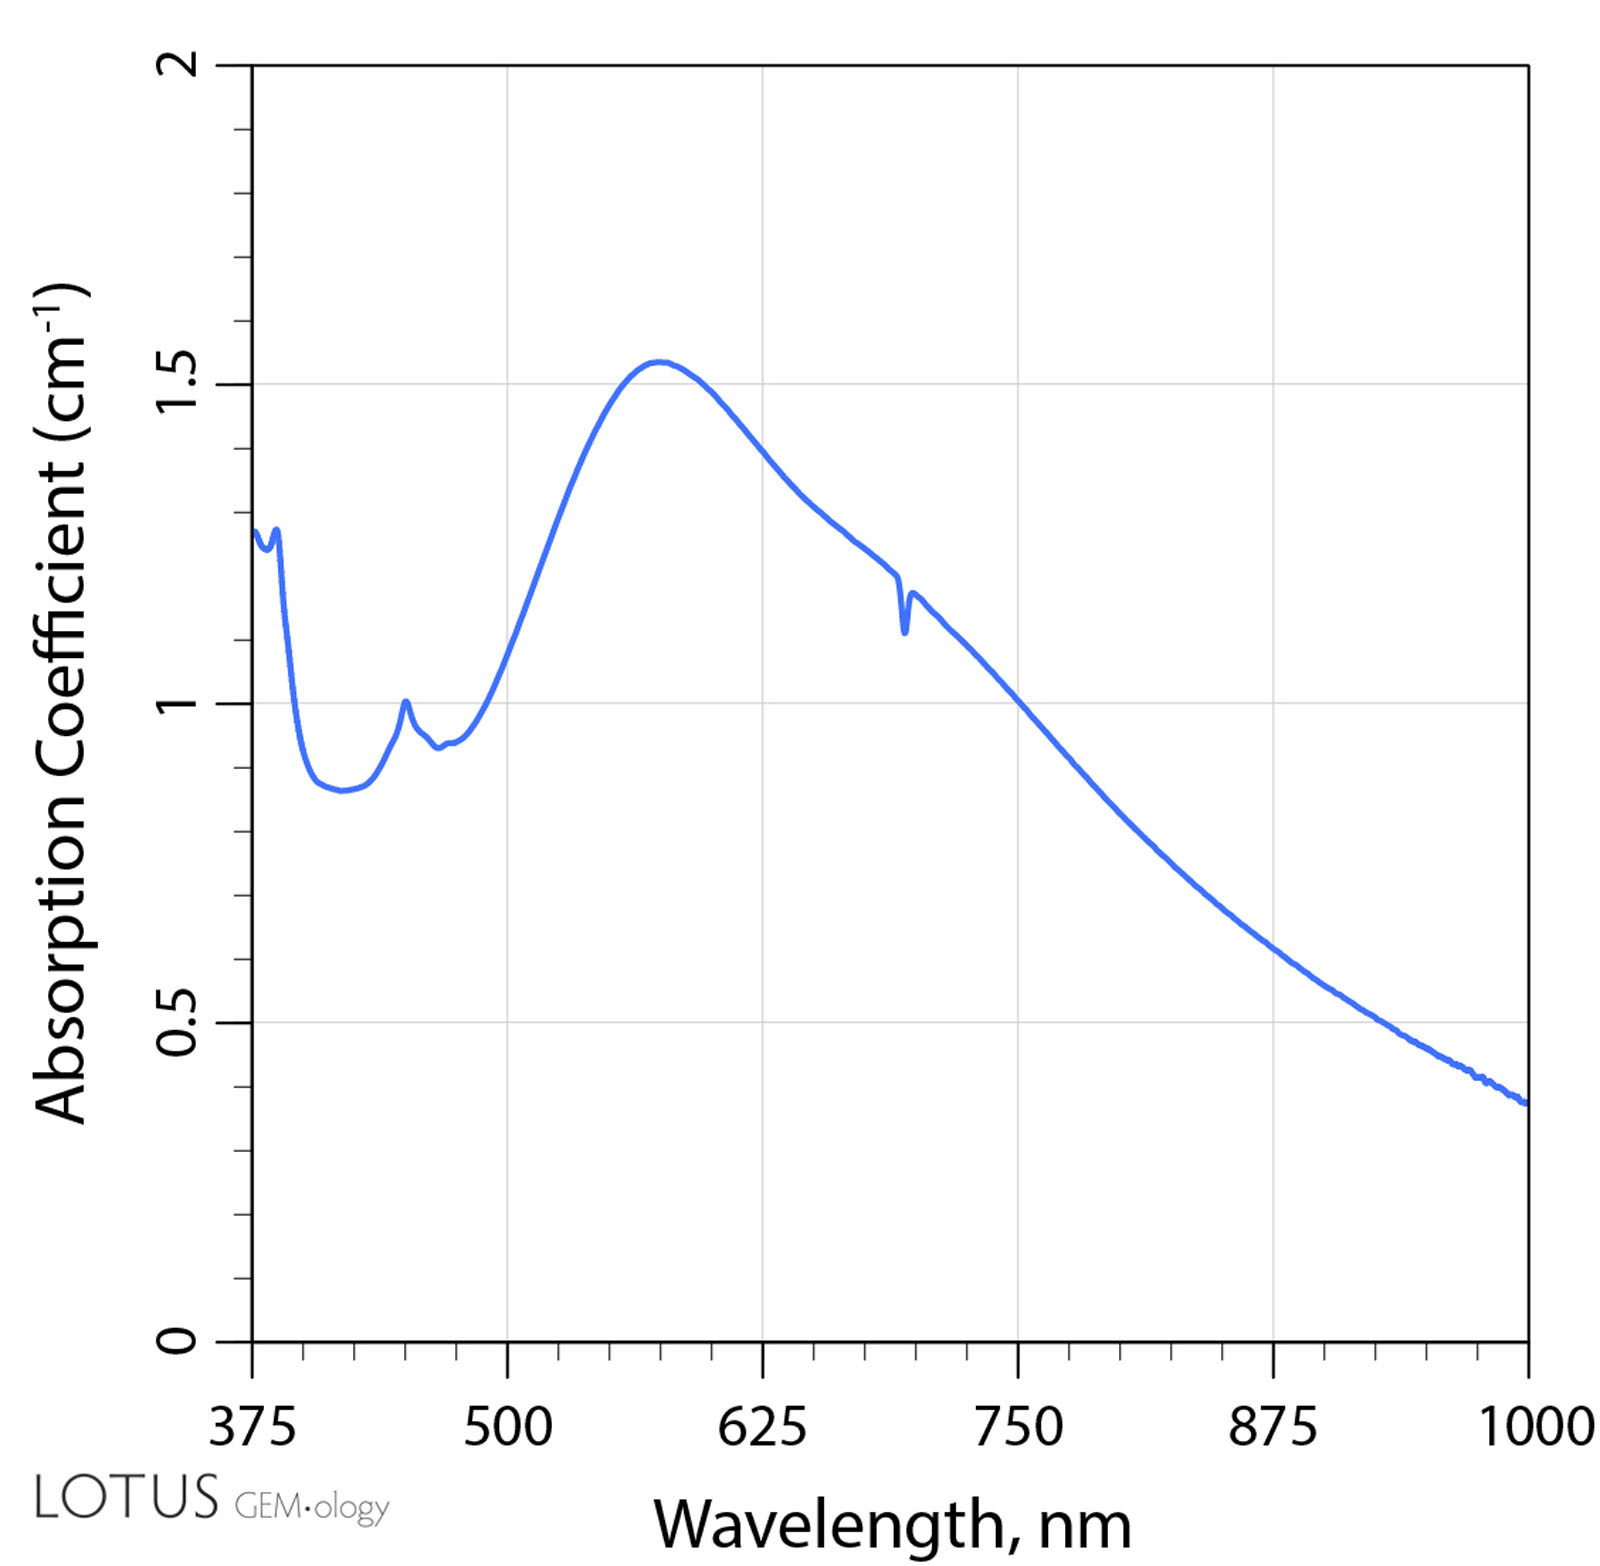
Ultraviolet/visible/near-infrared (UV-Vis-NIR) spectroscopy was conducted with a Magilabs GemmoSphere UV-Vis-NIR spectrometer. We recorded UV-Vis-NIR spectra before heating and after each stage of heating. Before heating, 11 of the 12 stones showed spectra typical of metamorphic sapphire, with prominent absorption between 500 and 600 nm (figure 12A). Only sample 3 showed a spectrum that was not typical of metamorphic sapphire (figure 13). It displayed absorption between 500 and 600 nm as well as a prominent peak at 880 nm, which is often associated with magmatic sapphires (Hughes et al., 2017).
| A. | B. |
 |
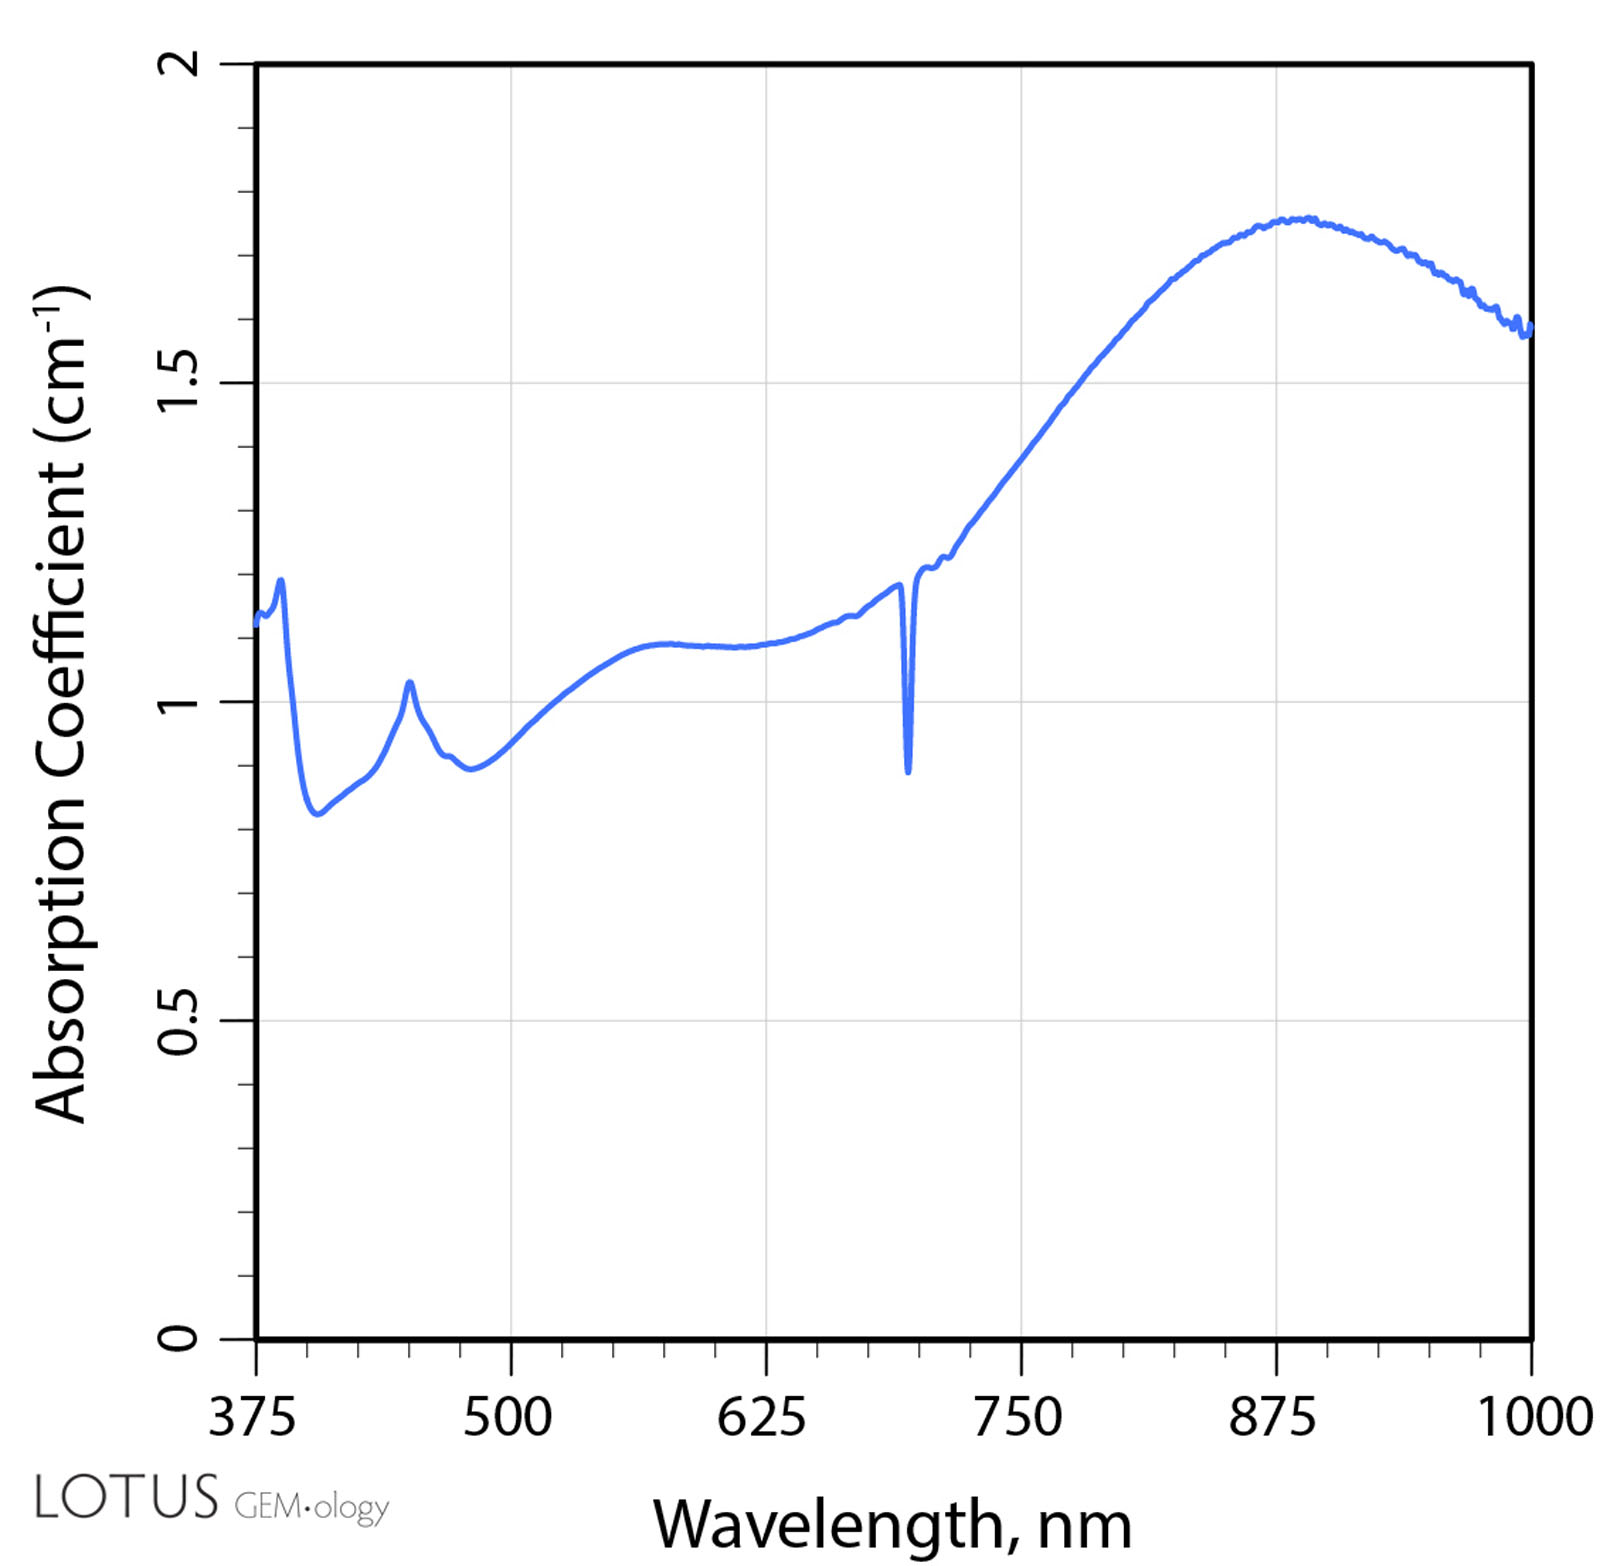 |
| Figure 12. UV-Vis-NIR spectrum of a Madagascar sapphire before and after heating A: The UV-Vis-NIR spectrum of sample 7 before heat treatment. Note that the most prominent feature is the absorbance between 500 and 600 nm, as well as a small Fe-related peak around 450 nm. B: The UV-Vis-NIR spectrum of sample 7 after heating to 900°C. Note the development of a large peak at ~880 nm. |
|
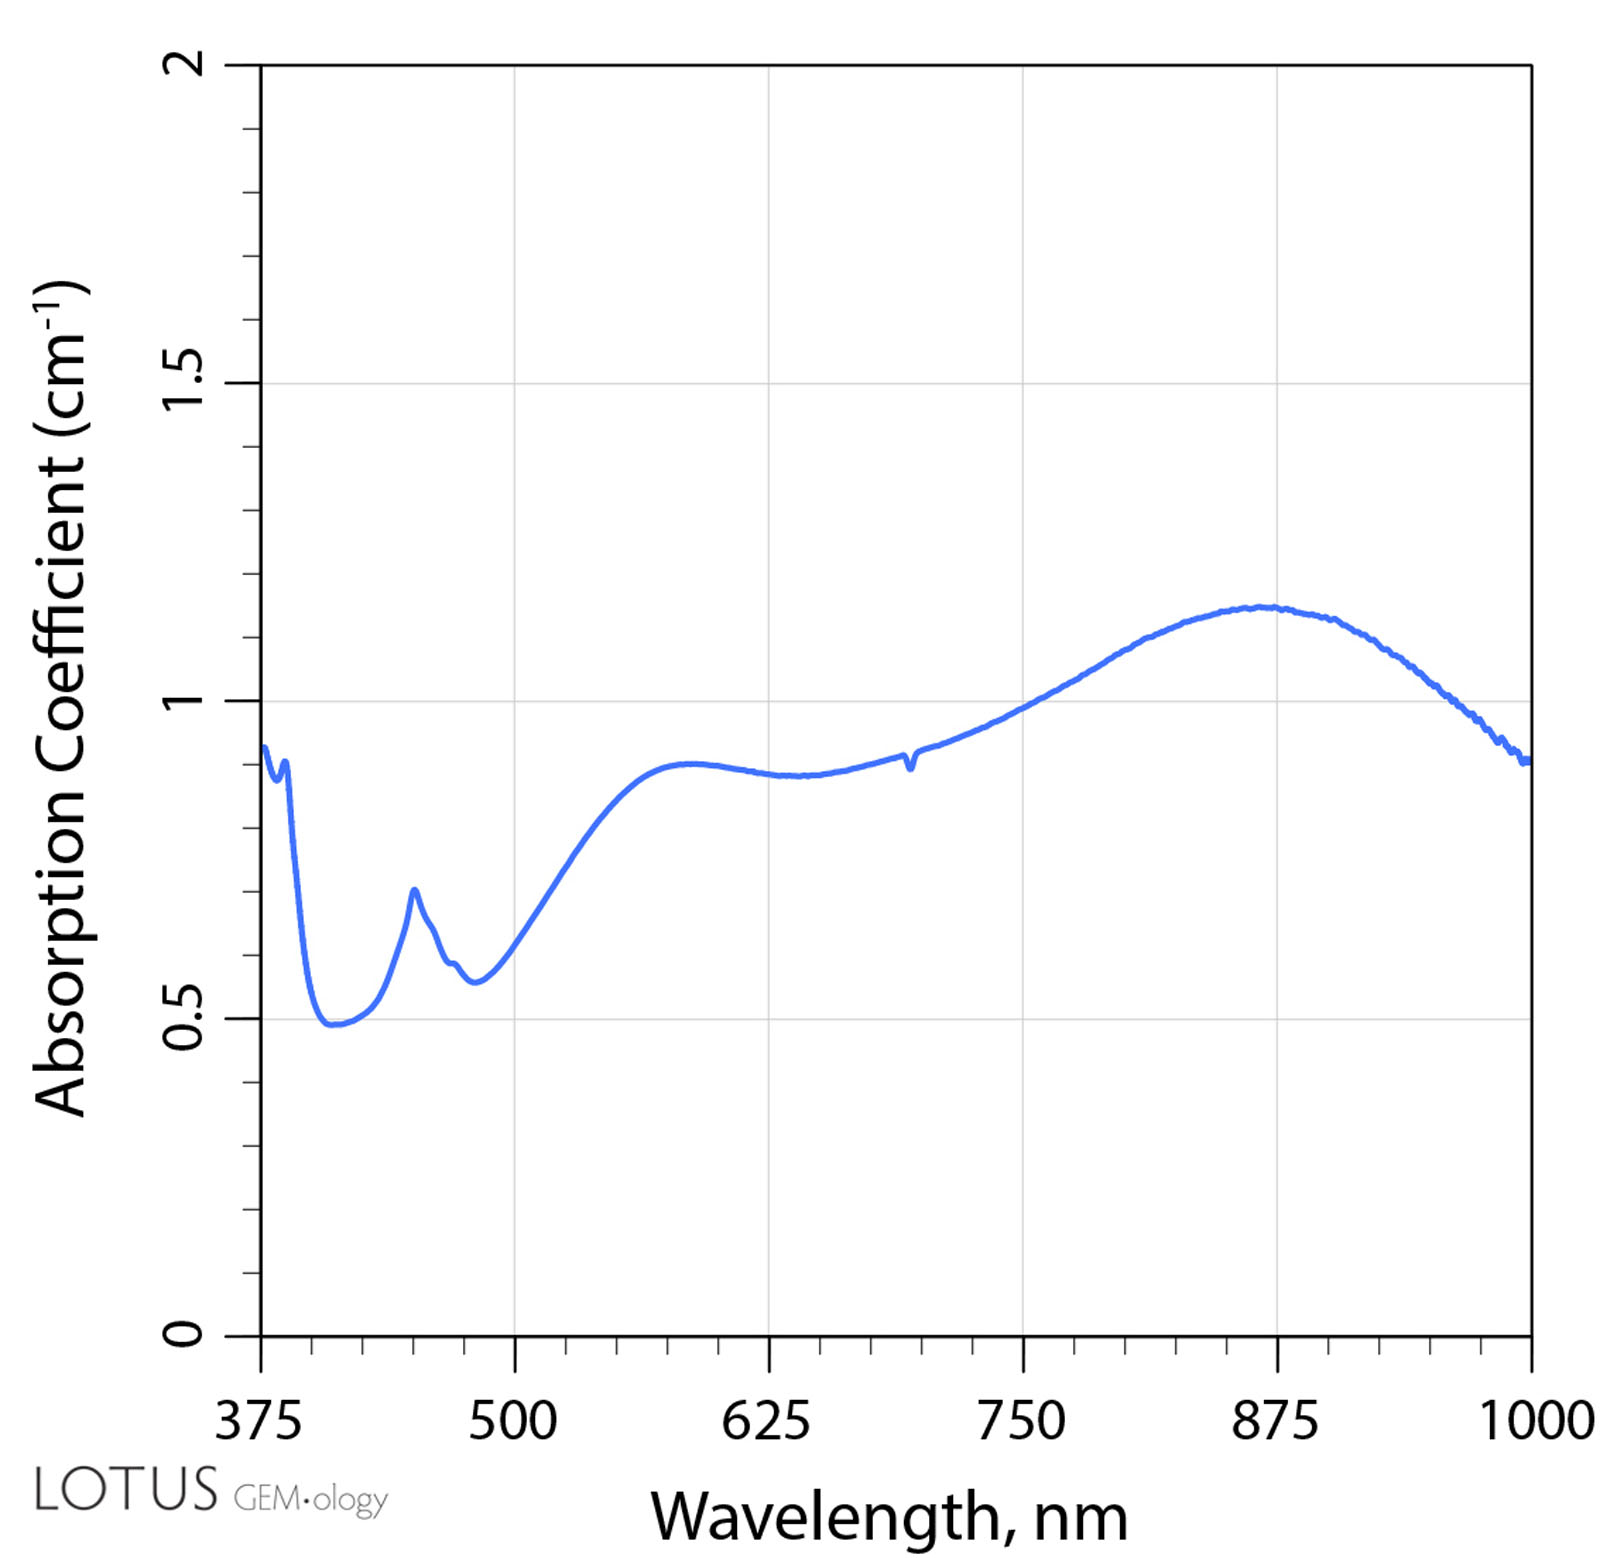 Figure 13. UV-Vis-NIR spectrum of a Madagascar sapphire before heating Sample 3 was the only one to display absorption from 500 to 600 nm as well as around 880 nm before heat treatment.
Eleven of the twelve stones also showed Fe-related peaks at 450 nm, ranging from weak to very strong. The only stone that did not initially display this peak was sample 1 (figure 14), which had both pink and blue zones. This stone showed transmission just below 700 nm in the red zone.
 Figure 14. UV-Vis-NIR spectrum of a Madagascar sapphire Sample 1 was the only one that did not display a peak at 450 nm.
After each round of heating, we ran the spectra again. With heating at 800°C, all of the spectra were similar to those obtained prior to heating.
For the next round, we heated the samples to 900°C. We were surprised to see two of the spectra change significantly. In samples 7 and 12, the peak between 550 and 600 nm became less prominent and a broad absorption band centered at 880 nm developed (figure 12B).
At first we suspected we had made an error, perhaps because we had focused on a slightly different area of the stones when running the spectra (see “Limitations of UV-Vis-NIR Results” below). We reran the spectra several times, with the same results. In the gemological literature, this shift has seldom been detailed. The earliest reference we found was with regard to heat-treated Montana sapphires, which also showed this shift after treatment (Emmett and Douthit, 1993). It was also reported in heated Madagascar sapphires in a master’s thesis (Worawitratanagul, 2005).
By the next round of heating, to 1000°C, this aberration became the trend. Samples 7 and 12 still displayed the peak around 880 nm, but five more stones also showed this shift (samples 2, 4, 5, 9, and 10). At 1100°C, the spectrum of sample 11 also displayed the shift, for a total of 8 out of 12.
Of the eight stones whose spectra changed to display this 880 nm peak, seven retained the peak after all subsequent rounds of heating. The only exception was sample 9, whose spectrum reverted to only showing absorption from 550 to 600 nm after heating at 1300°C. We are unsure of the cause. Further experimentation with samples aligned to the c-axis could be useful in exploring this further (again, see “Limitations of UV-Vis-NIR Results” below).
These significant spectral shifts showed a strong correlation with major changes in color after heat treatment. It has been suggested that there is a strong correlation between an 880 peak and a basalt-related origin. Given the fact that we have noted this peak in heated metamorphic sapphire, we would strongly caution against using the UV-Vis-NIR spectrum as the sole evidence of basaltic origin. As always, these spectra should be weighed with other factors.
Limitations of UV-Vis-NIR Results
We should note that the wafers were not oriented to the c-axis when they were polished, and spectra may have been taken from slightly different positions on the stone. This could affect the results.
However, the significant changes in a number of spectra (8 of the 12 stones) are strong evidence that this shift results from heat treatment, not just due to a different alignment of the stones while obtaining spectra. Future experiments with samples oriented for the c-axis and positioned identically would strengthen these results.
FTIR
Fourier-transform infrared (FTIR) spectroscopy was performed using a Bruker Tensor 27 spectrometer, with the samples placed on a Pike DRIFTS attachment and scanned 64 times at a resolution of 4 cm–1. Spectra were obtained before heating and after heating at each temperature, with the following results:
- In their unheated state and after heat treatment to 800°C and 900°C, none of the stones showed significant peaks.
- After heating to 1000°C, two of the samples started to show diagnostic peaks.
- Sample 2 showed very weak peaks at 3309 and 3232 cm–1. Once it was heated to 1100°C, these features became more prominent. This trend continued after heating to 1300°C, where in addition to the 3309 and 3232 cm–1 peaks, the 3186 cm–1 appeared in this series (figure 15). After heating to 1500°C, only the 3309 and 3232 cm–1 peaks were present. The presence of the 3309 peak by itself is not diagnostic evidence of artificial heat treatment in sapphire and ruby sourced from metamorphic rocks; however, the presence of a 3232 peak above the noise floor strongly suggests the stone has been artificially heated.
- Sample 8 displayed only a very weak 3309 cm–1 peak after heating to 1000°C and did not display diagnostic features after heating at any other temperatures.
- Once the stones were heated to 1100°C, two more stones started to show additional features.
- Sample 4 displayed weak peaks at 3309 and 3232 cm–1, which became more prominent after heating to 1300°C (figure 16). After heating to 1500°C, no diagnostic features were evident.
- Sample 6 also started displaying a very weak 3309 cm–1 peak at 1100°C, which was also present after heating at 1300°C and 1500°C.
- The remaining eight stones showed no diagnostic features after heating at all temperatures.
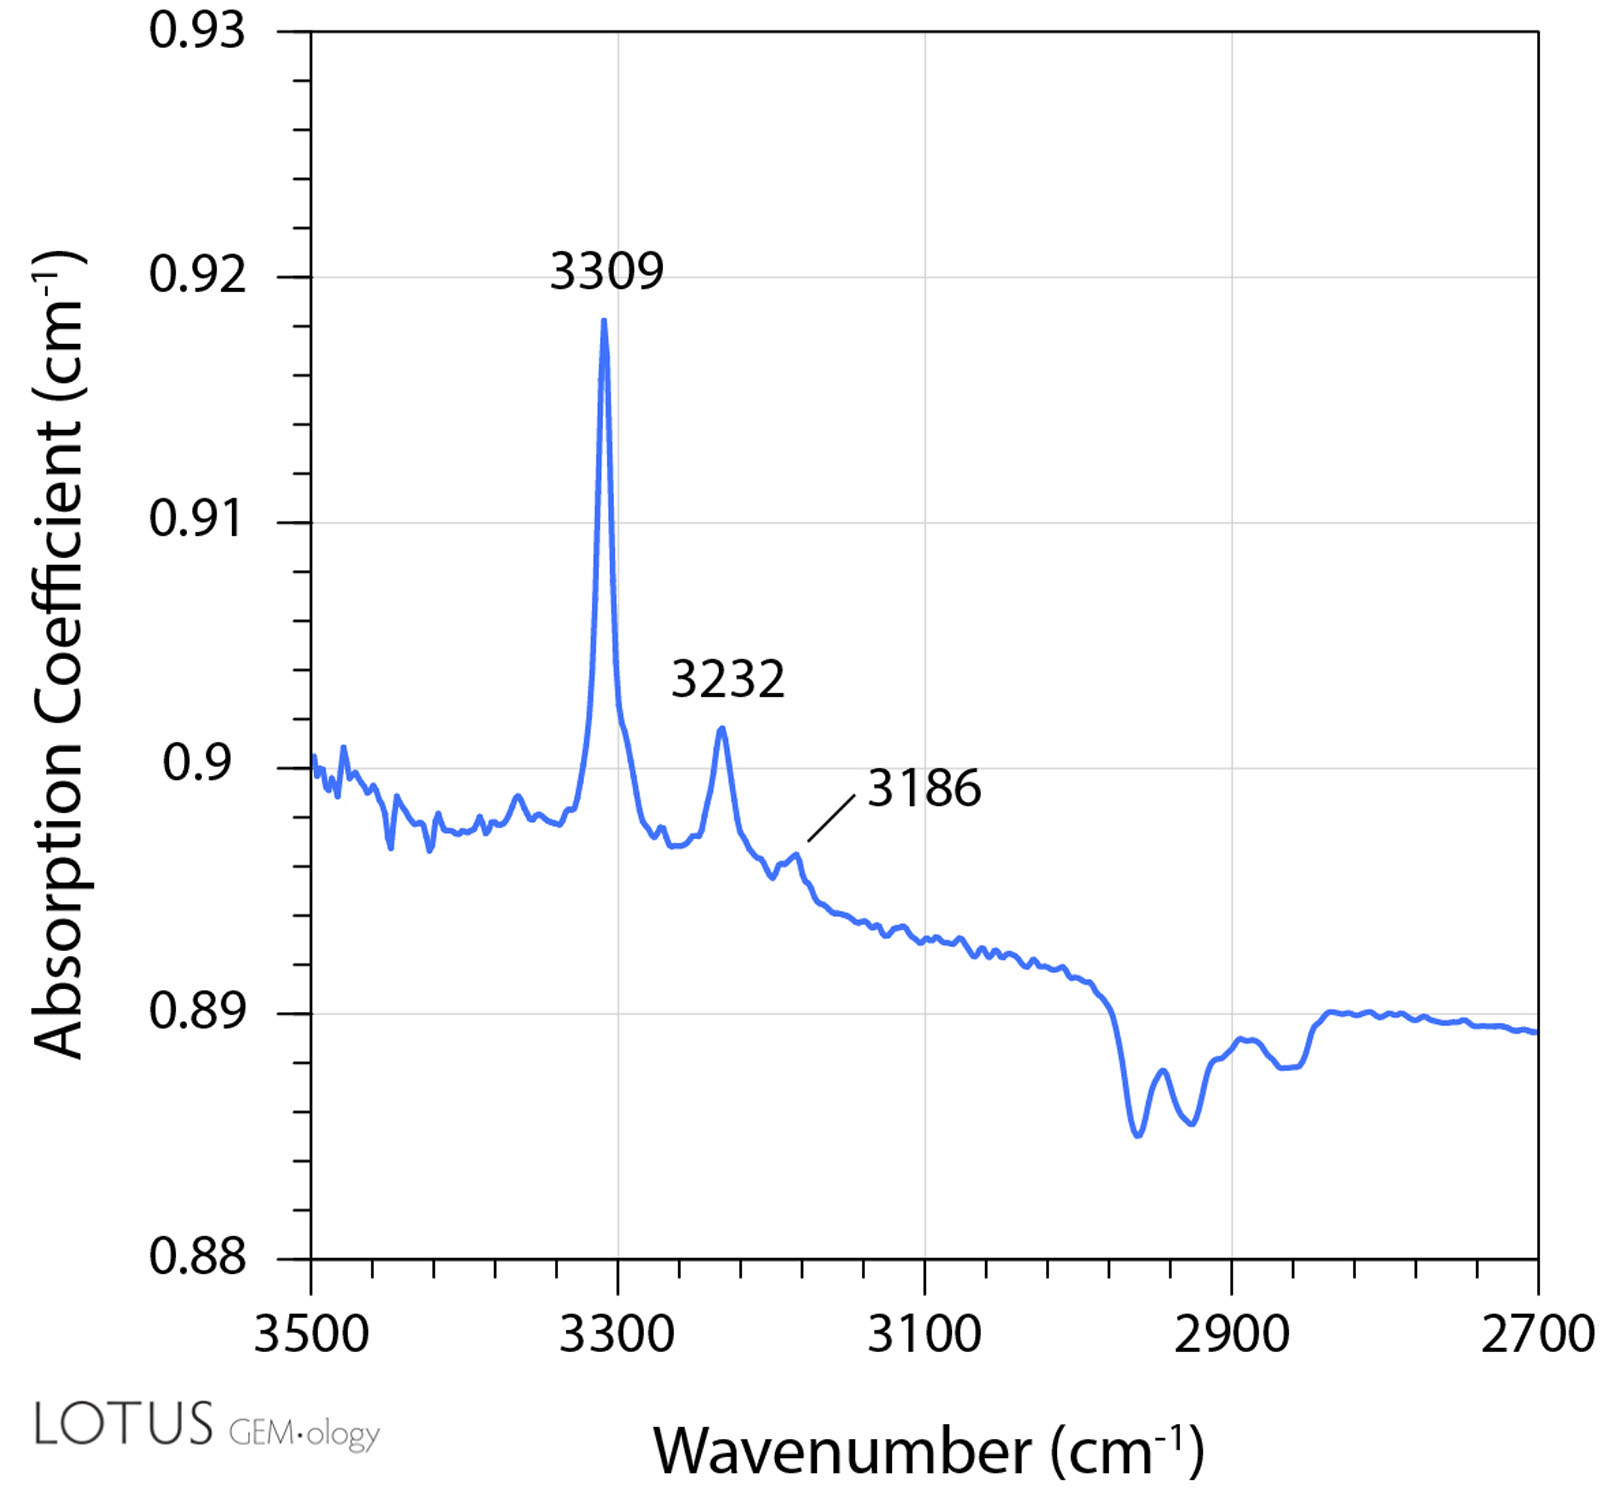 Figure 15. IR spectrum of a Madagascar sapphire after heating After heating to 1300°C, sample 2 developed a strong 3309 cm–1 series with peaks at 3309, 3232, and 3186 cm–1. In sapphires (and rubies) that have formed in metamorphic environments, the presence of the 3309 peak is not diagnostic; it is the appearance of the 3232 peak that provides strong evidence of artificial heat treatment.
 Figure 16. IR spectrum of a Madagascar sapphire after heating A medium 3309 cm–1 peak developed in sample 4 after heating to 1300°C.
Overall, the results suggest that the appearance of the 3309 cm–1 series (with a 3232 cm–1 peak) can be indicative of heat treatment in low-Fe metamorphic corundum. However, the lack of these features does not necessarily mean that a stone has not been heated. It is important to note that in high-Fe sapphires from basalt-related origins, a weak to medium 3309 cm–1 series with the 3232 cm–1 peak can often be found naturally and is therefore not a reliable indication of heat treatment (Hughes et al., 2017).
Limitations of FTIR Results
As with the results of UV-Vis-NIR testing, the FTIR results may be limited by the fact that the stones were not oriented to the c-axis and the spectra were not taken in the exact same position.
Fluorescence Reactions
Examining the fluorescence reactions of the stones was a major area of focus for this project, with a particular emphasis on short-wave reactions. The value of examining short-wave UV fluorescence in the study of corundum has been recognized for decades (Crowningshield, 1966), and it has been connected to the detection of heat treatment.
Fluorescence was initially observed using an Ultraviolet Products UVLS-26 EL Series UV lamp using a six-watt bulb, with a long-wave light source at 365 nm and a short-wave light source at 254 nm. If a reaction was found, we also examined the sample with the Magilabs custom-designed deep-UV fluorescence system, consisting of a fluorescence microscope setup equipped with a high-intensity pulsed xenon flash lamp with an interference bandpass filter at 228 nm.
Short-wave fluorescence photomicrographs were taken with a Canon EOS 6D camera connected to a Wild M400 microscope and the Magilabs custom-designed deep-UV fluorescence system.
Long-Wave Fluorescence
Under long-wave UV, about half of the unheated stones were inert and showed no reaction. The other half showed mostly weak to medium zoned orange fluorescence. Heating did not produce any significant changes in the long-wave fluorescence reaction of most samples.
The one exception to this pattern was in sample 1, a stone with strong pink and blue color zoning. The pink zone (which turned orange after heat treatment) fluoresced a strong orange, and the blue zones fluoresced a medium to strong red. The stone did not show significant change in long-wave fluorescence after heating.
Short-Wave Fluorescence
Prior to heat treatment, all of the stones were inert under short-wave fluorescence. We initially checked for fluorescence in our standard UV light box. If we saw any sign of fluorescence, we photographed it with the Magilabs custom-designed deep-UV fluorescence system. It was not until the stones were heated to 1000°C that we started to see changes, where some stones began to display a weak chalky blue fluorescence (figures 17–19). This chalky appearance has been associated with heat treatment in sapphires.
A. 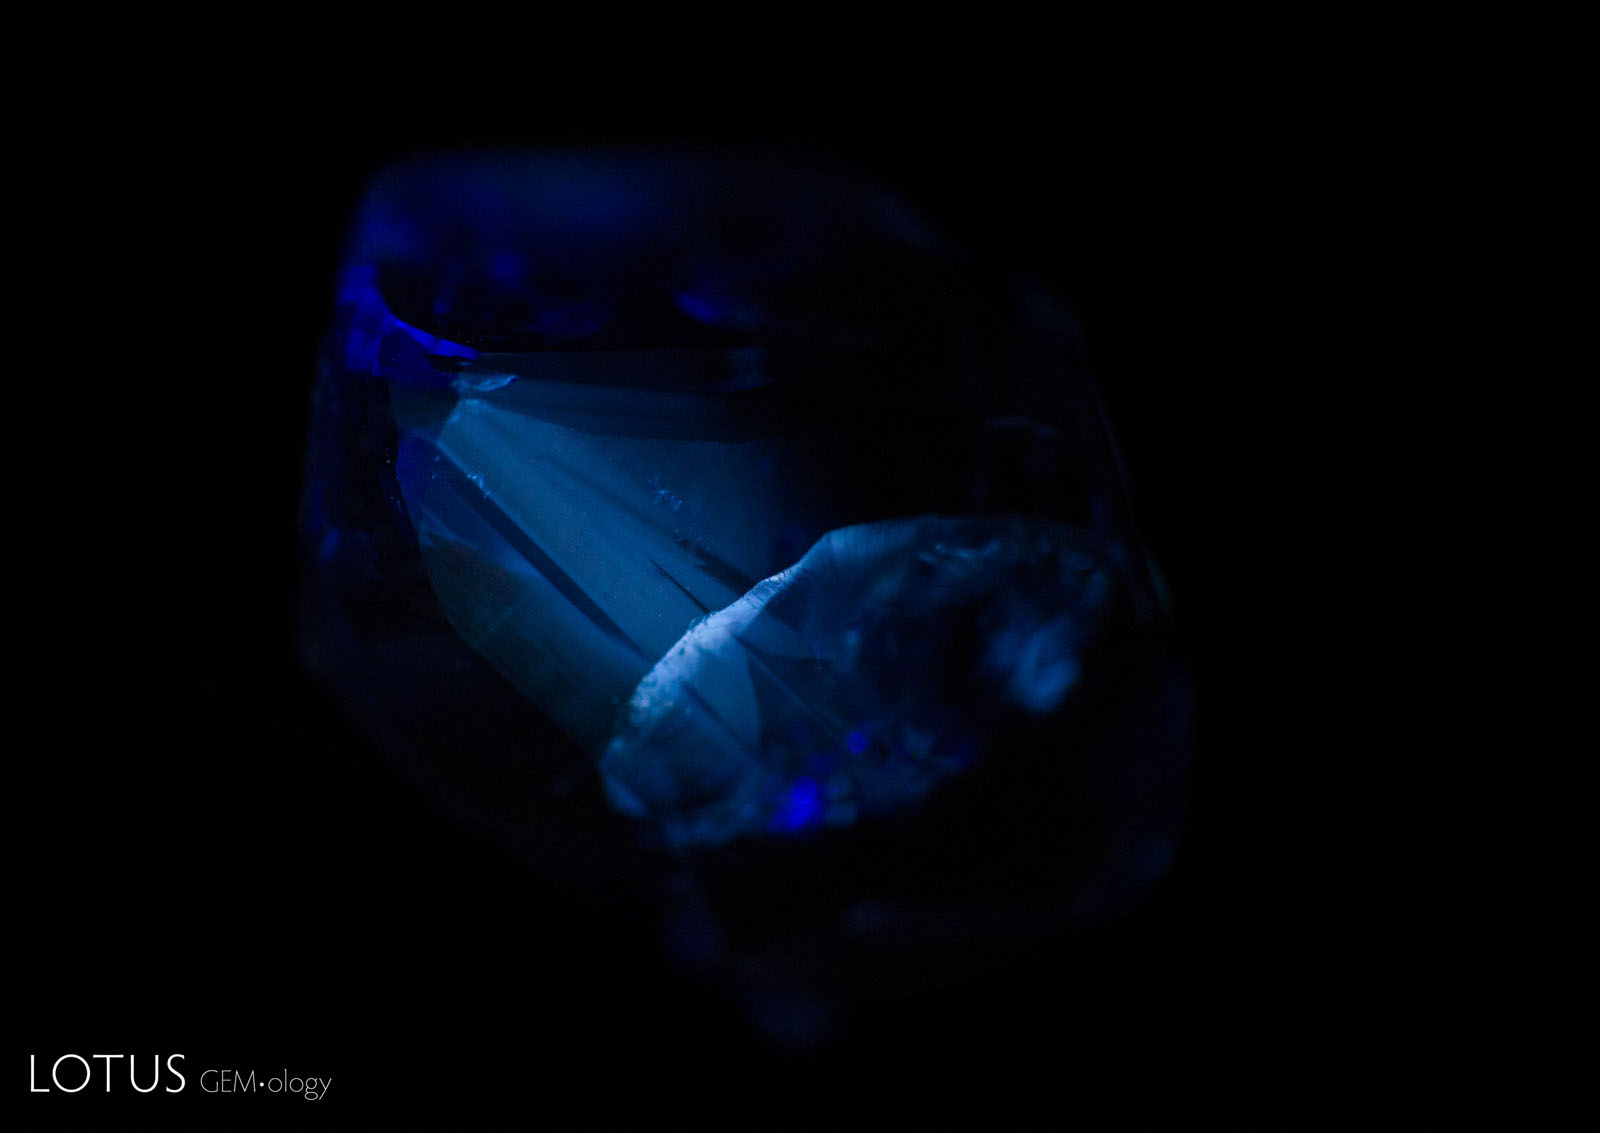 |
B. 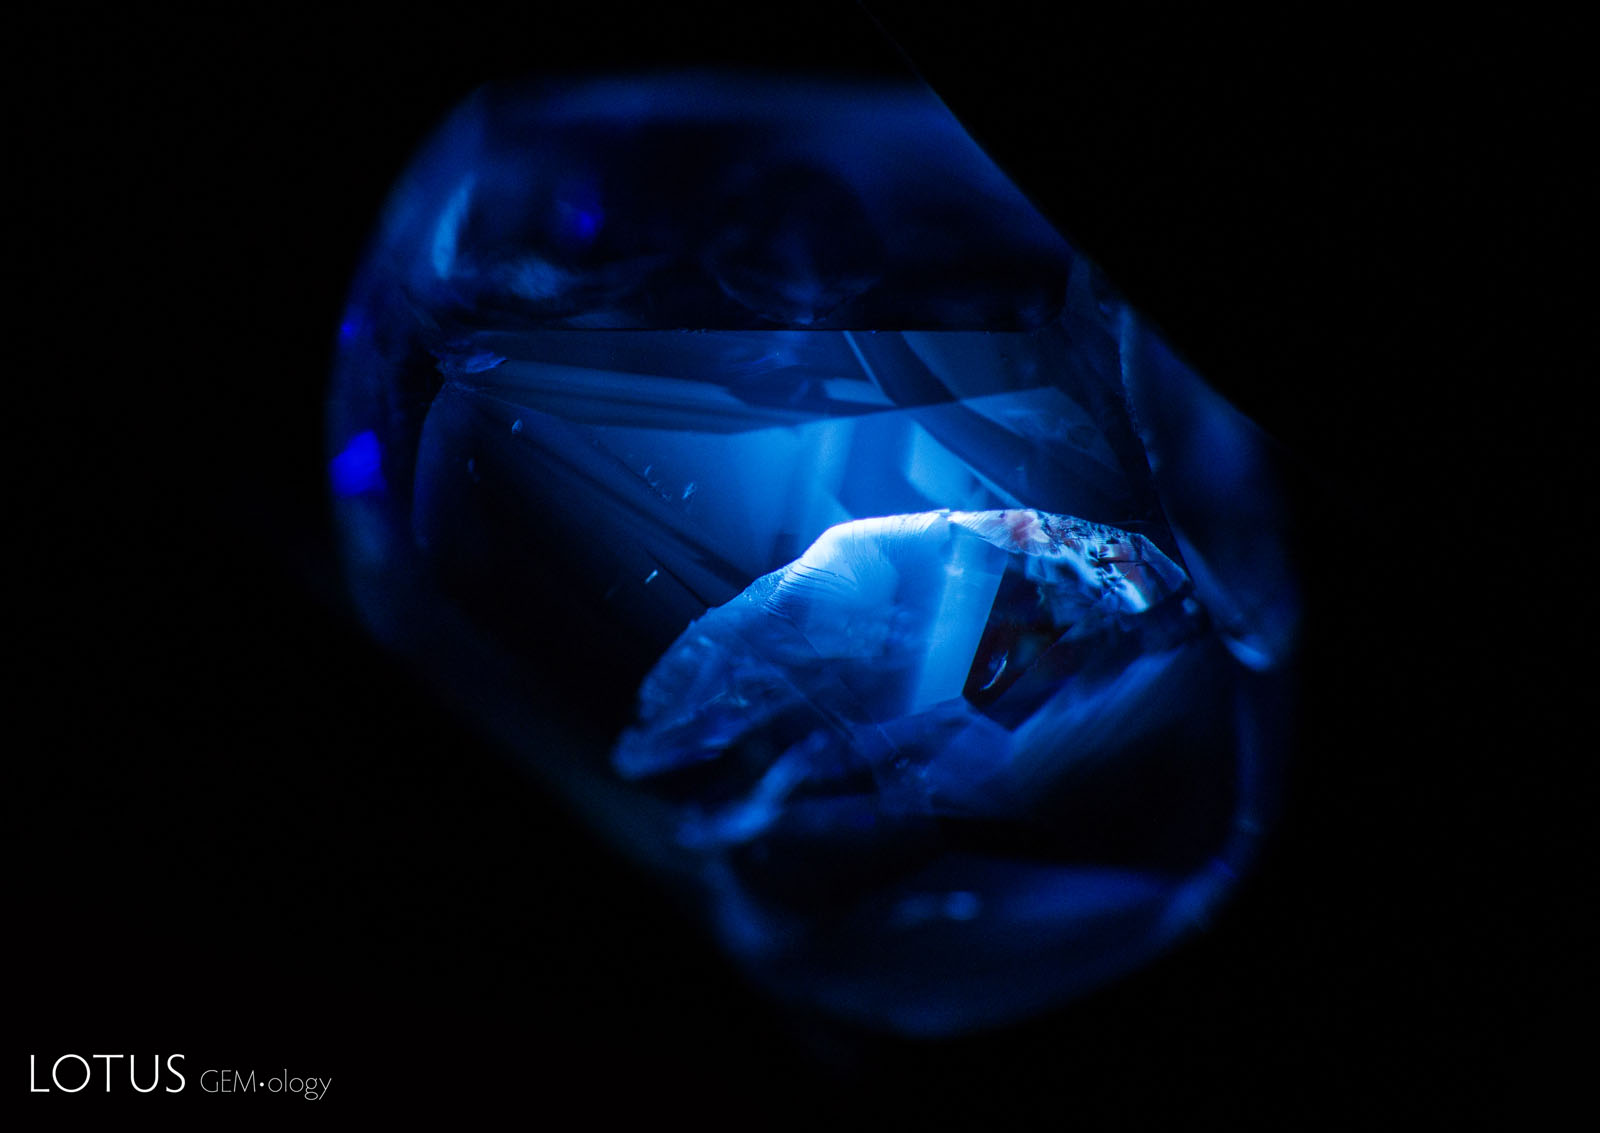 |
C. 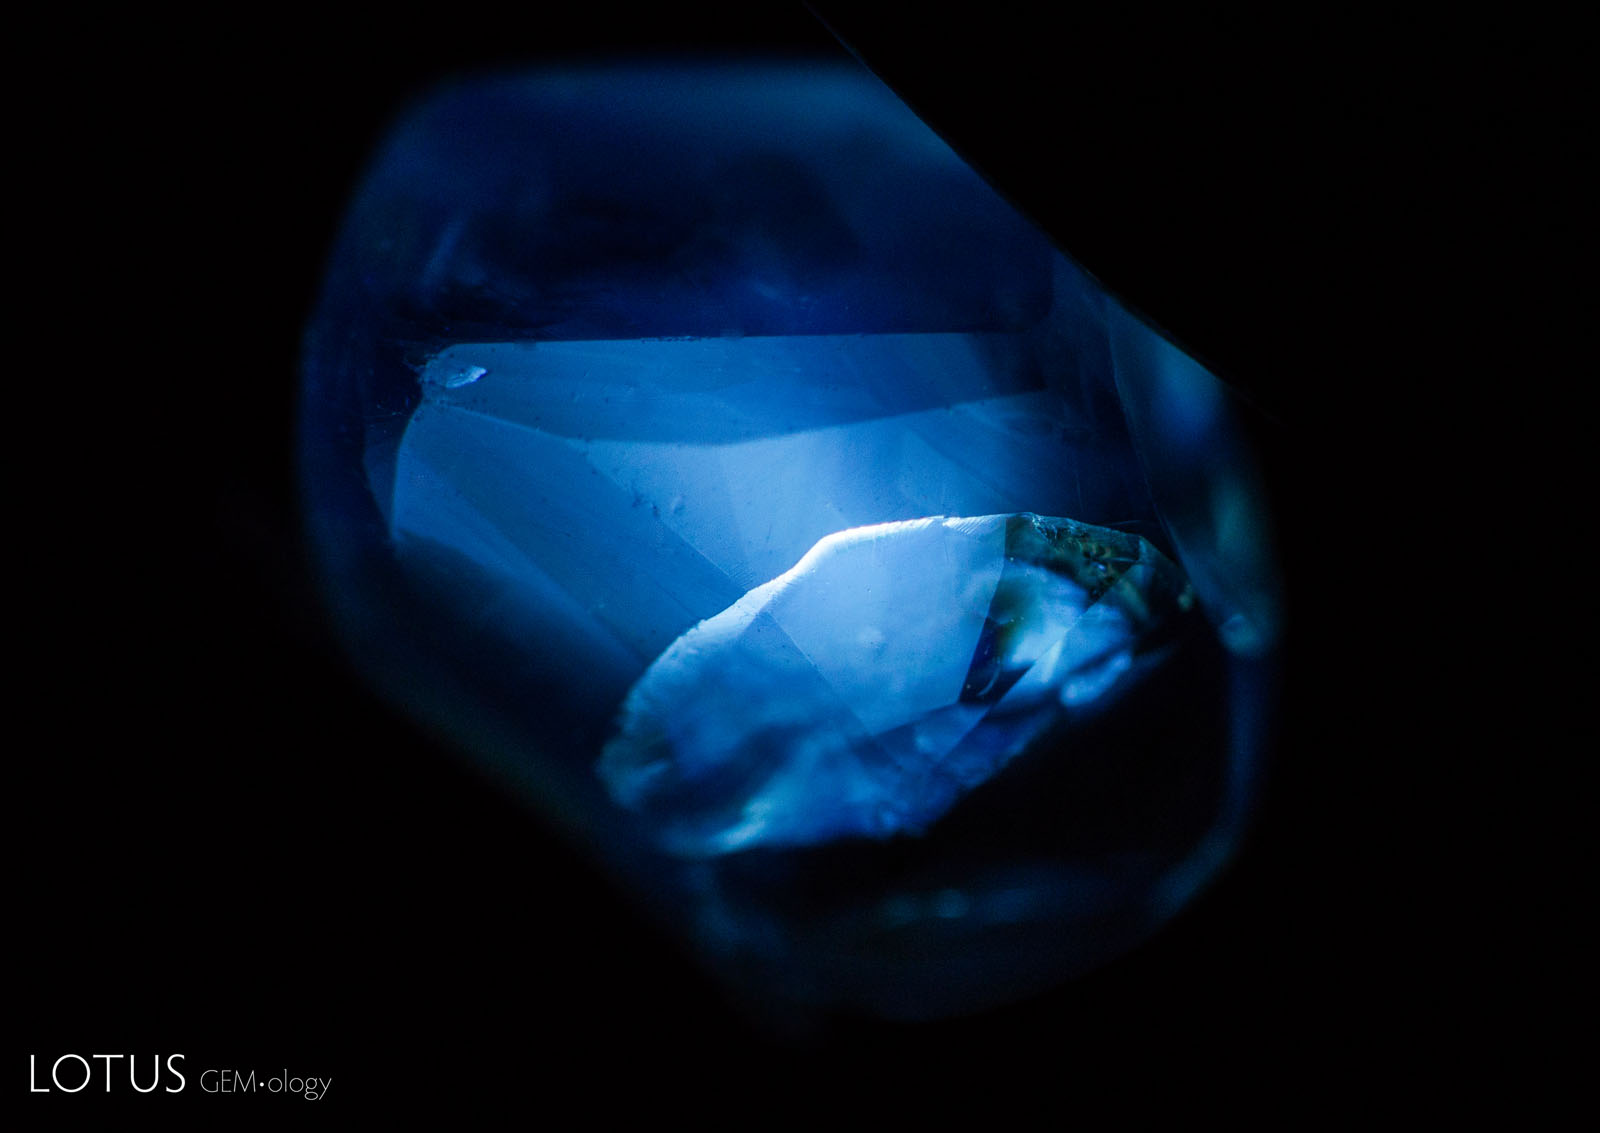 |
D. 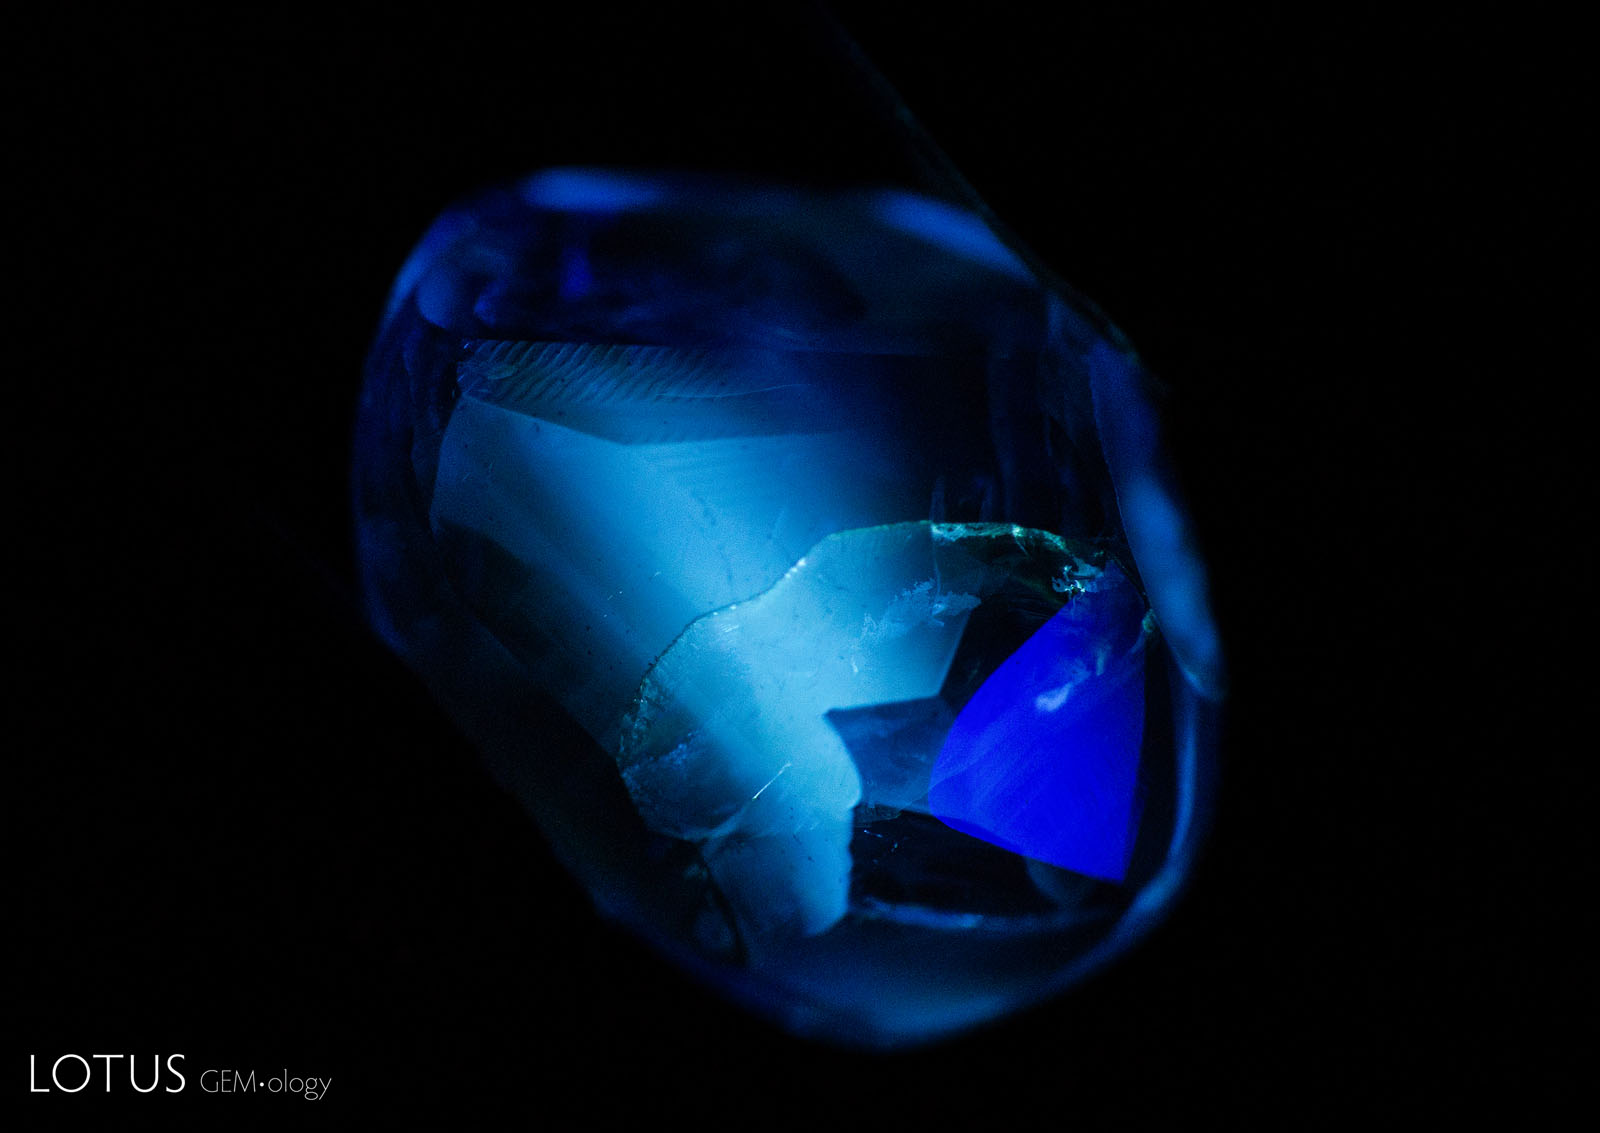 |
|
Figure 17. Fluorescence reaction of a Madagascar sapphire during heating |
|
 Figure 18. Short-wave UV fluorescence reaction of a Madagascar sapphire during heating Sample 10 did not show any short-wave fluorescence reaction until it was heated to 1000°C. At this point it displayed a strong chalky blue reaction, with complex angular fluorescent zones. Photo by E. Billie Hughes.
| A. | B. |
| |
|
Figure 12. UV-Vis-NIR spectrum of a Madagascar sapphire before and after heating
A: The UV-Vis-NIR spectrum of sample 7 before heat treatment. Note that the most prominent feature is the absorbance between 500 and 600 nm, as well as a small Fe-related peak around 450 nm.
B: The UV-Vis-NIR spectrum of sample 7 after heating to 900°C. Note the development of a large peak at ~880 nm.
In natural, heated sapphires, this chalky fluorescence is associated with the presence of rutile. Almost all natural blue sapphires contain some exsolved rutile (TiO2). When these sapphires are heated, there is a slow dissolution of rutile, which creates Ti4+ ions and Ti–Al vacancies. These will fluoresce when illuminated in short-wave UV. The strongly chalky areas will follow the zoning patterns of the rutile, and the strongest fluorescence will be in areas with the lowest Fe and highest rutile concentrations (Hughes et al., 2017, pp. 154–155).
Once we started using the Magilabs fluorescence unit, we realized the reactions were much stronger and clearer than in our Ultraviolet Products UVLS-26 EL Series unit. Thus, after this round of heating at 1000°C, we started looking at all stones in the Magilabs system. We found that two of the stones appeared inert in the regular unit but showed weak chalky fluorescence in the Magilabs unit.
By the time we heated to 1300°C, all 12 stones were showing at least a weak zoned chalky blue fluorescence reaction. A few of these stones appeared inert in our regular UV light box. Again, when we checked each stone in our Magilabs system, we began to see reactions that were either extremely difficult or impossible to see in our regular fluorescence unit. It is possible that the fluorescence was apparent after heating below 1000°C (the temperature where we first noticed it) but that we did not see the reaction because our regular UV unit was not strong enough. In future experiments, we plan to conduct observations with the Magilabs unit after all stages of heating.
In fact, some stones that appeared inert even in this Magilabs unit showed extremely weak chalky fluorescence once photographed. It seems that our camera was able to capture reactions that are so weak as to be almost imperceptible to the human eye. This suggests that there is considerable information we may be missing when using the traditional UV light box. The development of better instruments to examine short-wave UV reactions would be a significant stride for gemology, and we believe this improvement could be of great use in determining heat treatment in corundum.
Conclusions
Heat treatment from lower to higher temperatures can have a significant impact on the color of metamorphic blue sapphires from Madagascar. In our study, temperatures between 800 and 1100°C in air lightened the blue color, while higher temperatures, which can dissolve rutile, created deeper, more saturated blues.
Detection of this treatment is possible by a combination of observing inclusion features and short-wave UV fluorescence, as well as infrared spectroscopy. We believe that the study of short-wave UV fluorescence shows great promise in determining heat treatment in sapphire. It would be beneficial to the gemological community to find more detailed and accurate ways to observe this reaction at stronger power and with magnification.
It is important to note that the authors found that for many of the stones, the UV-Vis-NIR spectra showed a shift from primarily having peaks between 550–600 nm before heating to having a strong peak at 880 nm after heating. The experiments suggest that this 880 nm peak, which has often been correlated with sapphires of basalt-related origin, can also occur in heated metamorphic sapphires. Therefore, this peak should always be taken into consideration with other features before drawing a conclusion.
Our study of these stones demonstrates that heated metamorphic Madagascar blue sapphire can often be separated from unheated material, even when heated to temperatures as low as 800°C
![]()
About the Authors
E. Billie Hughes is Co-Founder and Managing Director of Lotus Gemology. She oversees the company's day-to-day operations while continuing gemological research and laboratory work. After graduating from UCLA in 2011, Billie became a Fellow of the Gemmological Association of Great Britain (FGA) in 2013. Her research focuses on ruby and sapphire, including low-temperature heat treatment, and she has authored and co-authored articles in leading gemological journals. An accomplished field gemologist, she has traveled to gem deposits around the world, including nearly every major ruby and sapphire locality.
Billie is an internationally recognized educator who has lectured for trade organizations, museums, and luxury jewelry houses. She has collaborated extensively with Van Cleef & Arpels on educational programs and lectures. An award-winning photographer and photomicrographer, her images have received honors in the Nikon Small World and Gem-A competitions and have appeared in publications including National Geographic and Forbes. She is also the creator of Hyperion, Lotus Gemology's online inclusion database, reflecting her commitment to making gemological knowledge more accessible.
Billie developed an interest in gemstones from an early age, accompanying her parents on expeditions to mines and gem-producing regions around the world. That lifelong passion for fieldwork, laboratory research, education, and photography continues to shape her work at Lotus Gemology today.
Rosey Perkins is an independent gemologist in London. She has traveled extensively in Madagascar. Her passion for colored stones has taken her to Australia, Colombia, Southeast Asia, and East Africa.
Acknowledgements
The authors would like to thank Dr. John L. Emmett of Crystal Chemistry (Brush Prairie, Washington) for advice and assistance in heat treatment. Richard W. Hughes and Wimon Manorotkul of Lotus Gemology (Bangkok) provided additional advice and assistance. Isaac Stern (Bangkok) and Simon Dussart of Asia Lounges (Bangkok) helped in sourcing samples. Marc Noverraz and Guillaume Soubiraa of Colorline Madagascar assisted in sourcing samples and organizing field trips to Ilakaka, Madagascar. We thank Harvey Bamford of Gem Heat (Bangkok) for sample preparation. Neil Doohan (Bangkok) allowed us to photograph the faceted sapphire. Dr. Andreas Burkhardt (Zollikon, Switzerland) offered advice on EDXRF. We thank Dr. Amos Fety, Michel Rakotondrazafy, and Mahefa Ramangalahey of the Université d’Antananarivo (Antananarivo, Madagascar) for in-country support. Finallly, we thank Mikko Åström and Alberto Scarani of Magilabs for designing the deep UV fluorescence unit.
Notes
This article first appeared in Gems & Gemology (Summer 2019, Vol. 55, No. 2).
References
- Crowningshield R. (1966) Developments and Highlights at the Gem Trade Lab in New York: Unusual items encountered [sapphire with unusual fluorescence]. Gems & Gemology, Vol. 12, No. 3, p. 73.
- Emmett J., Douthit T. (1993) Heat treating the sapphires of Rock Creek, Montana. Gems & Gemology, Vol. 29, No. 4, pp. 250–272.
- Hughes R.W., Emmett J.L. (2004) Fluxed up: The fracture healing of ruby. The Guide, Sept.–Oct., Vol. 23, No. 5, Part 1, pp.1, 4–9.
- Hughes R.W., Pardieu V., Schorr D. (2006) Sorcerers and sapphires: A visit to Madagascar. The Guide, Jan.–Feb., Vol. 25, No. 1, pp. 1, 4–6.
- Hughes R.W., Manorotkul W., Hughes E.B. (2017) Ruby & Sapphire: A Gemologist’s Guide. RWH Publishing/Lotus Publishing, Bangkok, 816 pp.
- Kröner A., Windley B.F., Jaeckelt P., Brewer T.S., Razakamanana T. (1999) New zircon ages and regional significance for the evolution of the Pan-African orogen in Madagascar. Journal of the Geological Society, Vol. 156, No. 6, pp. 1125–1135.
- Krzemnicki M., Cartier L.E., Wang H.A.O., Zhou W., Lefèvre P. (2017) Sapphires from a new deposit at Bemainty near Ambatondrazaka in Madagascar. InColor, No. 35, pp. 44–47.
- Link K. (2015) Age determination of zircon inclusions in faceted sapphires. Journal of Gemmology, Vol. 34, No. 8, pp. 692–700.
- Pardieu V., Vertriest W., Weeramonkhonlert V., Raynaud V., Atikarnsakul U., Perkins R. (2017) Sapphires from the gem rush Bemainty area, Ambatondrazaka (Madagascar). GIA News from Research.
- Peretti A., Peretti F. (2017) Identification of sapphires from Madagascar with inclusion features resembling those of sapphires from Kashmir. InColor, No. 35, pp. 34–42.
- Perkins R., Pardieu V. (2016) Gem News International: Sapphire rush near Ambatondrazaka, Madagascar. Gems & Gemology, Vol. 52, No. 4, pp. 429–430.
- Rakotondrazafy A.F.M., Giuliani G., Ohnenstetter D., Fallick A.E., Rakotosamizanany S., Andriamamonjy A., Ralantoarison T., Razanatseheno M., Offant Y., Garnier V., Maluski H., Dunaigre C., Schwarz D., Ratrimo V. (2008) Gem corundum deposits of Madagascar: A review. Ore Geology Reviews, Vol. 34, No. 1–2, pp.134–154.
- Worawitratanagul P. (2005) Heat treatment of sapphires from Ilakaka, Madagascar. Master’s thesis, Chiang Mai University, Thailand.
![]()